Primavera Project Management (P6) Activity Bars

Figure 3 Display Column - Primavera Project Management - Primavera Bar Labels Bar Chart

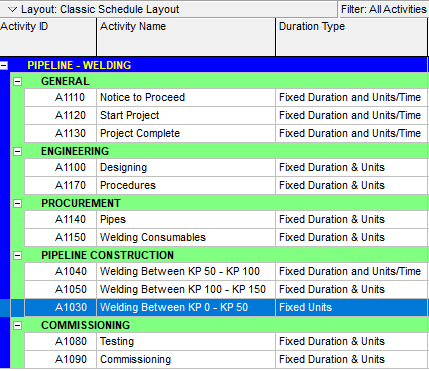
Gantt view of Oracle Primavera P6 Professional Project Management Software is designed to visualize large-scale, highly sophisticated, and complex projects. Activities are represented as bars along with a timescale in Primavera P6 Gantt Chart (Bar Chart) View. Most of the project scheduling software tools use a Gantt view to demonstrate activities and their dependencies in a work schedule. Primavera P6 allows you to customize activity bar labels by changing default colors, patterns and type to support the graphical presentation of the schedule. Numerous bar labeling options can be used to customize the activity bars. In this article, we will take look at the Primavera Project Management (P6) custom activity bars, bar charts and labels.

Bar Chart (Gantt View) of Primavera P6 Project Management Tool

In Primavera P6, activities are represented as bars in the Gantt View. In order to open the Gantt View, select View | Show on Top | Gantt Chart from the main drop-down menu at the top of the screen as shown in Figure 1.

Primavera Project Management Bar Chart (Gantt View)

Activity dependencies can be shown by clicking on the button “Relationship Lines” at the top of the screen.

Primavera Project Management Software Tools - Primavera P6 Bar Chart Labels

Relationships are the logic ties or network connectors that hold the activities in a network system. Relationship Lines button is useful to show or hide the activity relationships in the Gantt View.

Primavera P6 has both predefined bar labels and related filters that provides the opportunity to create new bar labels.

Bars window of Primavera is used to customize the appearance of the activities. To open the “Bars” window, select View | Bars from the main drop-down menu or click on the Bars icon in the layout toolbar.

The Bars window is very useful to modify the appearance of the bars that represent the activities. It is possible to customize Name, Display, Timescale, Filter and Preview features of each bar by the help of Bars window.

Primavera Project Management (P6) Custom Activity Bars, Bar Labels


Bar style tab is used to customize the appearance of the bars. Cap styles at each end of the bar can be changed. Bar shape can be thickened or thin, color and pattern can be modified as shown in Figure 2.

P6 Bars

The Display column is used to show or hide an activity bar type, Figure 3. Visibility of an activity type can be changed by clicking the checkbox.

Figure 3 Display Column - Primavera Project Management Software Tools -Primavera P6 Bar Chart Labels

The filter column is related with the Primavera P6 Filter By feature. Open the Filters window by double-clicking on the Filter column of the Remaining Level of Efford Bar, Figure 4.

Figure 4 Level Of Effort Filter - Primavera Project Management Software Tools - Primavera P6 Bar Chart Labels

As shown in the figure above, the filter of the selected bar is set to Remaining Level of Effort default filter. In this article, we will not analyze the filtering feature of Primavera P6. You can read the article related to Primavera Filter By feature.

Adding New Bar Type


It is possible to add a new bar type and customize it by using the Primavera P6 Custom Activity Bars feature. In this example, we will create a custom bar for a specific activity code. Assume that you are a planning engineer and your project manager asked you to change the color of the activities under mechanical works activity code.

In the Bars Window, click Add button on the right hand and type the name of the new bar type as “Mechanical Works”. Set the Timescale as “Remain Bar” and select the purple color from the Bar Style tab, Figure 5.

Figure 5 Add Bar For Mechanical Works -Primavera P6 Bar Chart Labels

Open the Filters window by double-clicking on the Filter column of the newly created Mechanical Works Bar then click on the “New” button to define the parameters. Select formerly created Responsibility code for the parameter and select Mechanical Works activity code value for the Value column, Figure 6.

Figure 6 Filter Parameters -

Click Ok and turn back to the Bars window. Click on the apply button and see that all the mechanical work activity bars are purple, Figure 7.

P6 Bar Labels

Bar Labeling Options


Bar labels tab of the “Bars” window enables to modify the labeling of a bar on the Gantt chart. Bar label can be positioned to the right or left of a selected bar type. In our sample, click on the “Remaining Work” bar to modify.

Oracle P6 Labeling Options

Then, click add buton on the “Bar Labels” tab. Placement of the bar label can be selected under the “Position” column as shown in the figure below.

Oracle P6

In the Gantt View of Primavera P6, activity information such as Activity ID, Activity Description, Original Duration, Total Cost etc. can be displayed by selecting related information from the Label column.

Summary

Primavera project management software tools offer advanced solutions to project teams for planning and managing projects successfully. Primavera project management software tools have advanced project management, product management, reporting and collaboration capabilities to support project scheduling, communication and procurement.

Primavera Project Management tools provide today’s project managers and planning engineers what they need to plan and manage their projects successfully. Up to 100,000 activities can be inserted and an unlimited number of resources can be aligned to model the projects across all industries.

Primavera P6 Custom Activity Bars feature enables to create and modify the bar chart for various activity types and classifications. Customizing activity bars provide a better graphical presentation of the schedule, especially in large and complex projects.

See Also


Microsoft Project vs Primavera

Primavera P6 Filters

Primavera Project Planner

Primavera P6 Download and Install Free Trial Version

Oracle Primavera P6 Software Download Free Trial Version

Oracle Primavera P6 Professional Software is one of the most popular project scheduling tools that provide advanced project management solutions to planning engineers, schedulers, project managers, stakeholders, and any others who are associated with a project. Many people think that … Read more

Primavera P6 Filters Explained (Filter By Feature)

In large and complex project schedules, it may be very difficult to view activities under a specific group, work breakdown structure level or an activity code. However, if you apply some basic techniques, you can easily filter activities, activity groups and resources by using the Primavera P6 Filter by feature. Assume that you are a planning engineer of a highway project and the client asked you to show the activities in a certain field. Primavera P6 Filters allows you to filter these activities by using activity codes or WBS levels. In this tutorial, we will discuss the filter by feature and demonstrate how to filter activities in Primavera P6.

Primavera P6 Filters and Filter By Feature

In our sample project, we will create a responsibility code and assign it to the related activities so that only the work performed by the selected responsibility code may be clearly visible.

Before to filter the activities, select Enterprise | Activity Code from the main drop-down menu at the top of the screen in order to define a responsibility code. This will display the Activity Codes window in the below figure, Figure 1.

Figure 1 Activity Codes Window
Figure 1 Activity Codes Window – Primavera P6 Filters

Click on the “Modify” button on the right-hand side of the window and type the name as Responsibility, Figure 2.

Figure 2 Activity Code Definitions
Figure 2 Activity Code Definitions – Primavera P6 Filters

Close the Activity Code Definitions window and see the newly created Responsibility code, Figure 3.

Figure 3 Activity Codes - Responsibility Code
Figure 3 Activity Codes – Responsibility Code – Primavera P6 Filters

Now, click on the “Add” button on the right-hand side of the window and define the responsibilities, Figure 4

Figure 4 Defining Responsibility Codes
Figure 4 Defining Responsibility Codes – Primavera P6 Filters

Assume that there are two engineers in your project. Mechanical Engineer is responsible for the pipeline construction activities given below,

  • Bending
  • Stringing
  • Welding
  • NDE/NDT

And the Civil Engineer is responsible for the below activities

  • Clearing and Grading
  • Trenching
  • Lowering
  • Backfilling


Assigning the Activity Codes to Filter By Activities

Primavera P6 offers many ways to assign the activity codes to the activities. Activity details can be used at the bottom layout. However, using the columns is the easiest option.
Select View | Columns from the main drop-down menu at the top of the screen and add the “Responsibility” columns as shown in the figure below, Figure 5

Figure 5 Customizing Columns -How To Filter Activities In Primavera P6 Filter By Feature
Figure 5 Customizing Columns – Primavera P6 Filters

Select the activity and double click on the “Responsibility” columns. This will open the Select Responsibility window and select the related engineer as shown in the figure below, Figure 6.

Figure 6 Selecting Responsibility Codes -How To Filter Activities In Primavera P6 Filter By Feature
Figure 6 Selecting Responsibility Codes

Filtering Activity Codes with Primavera P6 Filter By Feature

All the codes are assigned to the activities. Now it is possible to filter the activities under the responsibility of the Mechanical Engineer. Select View | Filter By from the main drop-down menu and click on the “New” button to define the filtering parameters as shown in the figure below, Figure 7.

Figure 7 - How To Filter Activities In Primavera P6 Filter By Feature
Figure 7 Filtering Parameters – Primavera P6 Filters

Name the filter “ Mechanical Works” and select the Responsibility for the parameter and Mechanical Engineer for the value. Click on the “OK” button and turn back to the previous window and run the filter.

Here below figure shows only activities performed under the responsibility of the Mechanical Engineer, Figure 8.

Figure 8 Activities
Figure 8 Activities

Summary


You can create various filters by using activity codes, resource id’s, work breakdown structure codes, date ranges, durations, activity types. The Filter by feature enables to view activities by using a long list of options available in this feature. Using group and sorting and filtering features provide a well reporting system for your schedule.

See Also

Primavera P6 Tutorial

Resource Leveling

External Reference

docs.oracle.com

Resource Leveling Feature of Primavera P6

Resource Levelling Definition Example Primavera P6

The term resource leveling is widely used in project management to refer to resource optimization and limitation. Resource leveling is considered as one of the basic elements of resource management within the project. According to the PMBOK Guide, resource leveling … Read more

Stacked Bar Chart and Primavera P6 Stacked Histogram

Stacked Bar Chart - What Is A Stacked Bar Chart ? Primavera P6 Stacked Bar Chart &Amp; Stacked Histogram

Charts and histograms are visual presentation tools that help readers to understand, analyze and demonstrate the percentages and/or quantities of particular results. Pie charts, line graphs, stacked histograms, bar charts are used to visualize the key parts of large data … Read more

Resource Loading in Oracle Primavera P6

Oracle Primavera P6

High efficiency is key to success for any project in today’s economic conditions. Planning, allocating, and tracking resources effectively through a software tool is a good practice for resource management in a project. Basically, resource loading, resource leveling, and resource … Read more

Cost Loading in Oracle Primavera P6

Primavera P6 Cost Loading, Cost Management, Cost Loaded Schedule

Cost loading and resource loading terms are widely used in project planning to refer time distributed value of costs and resources. Project managers need resource and cost loaded work schedules to make realistic assumptions and forecasts for their project’s targets. … Read more