How to Create Effective Gantt Charts Step by Step?
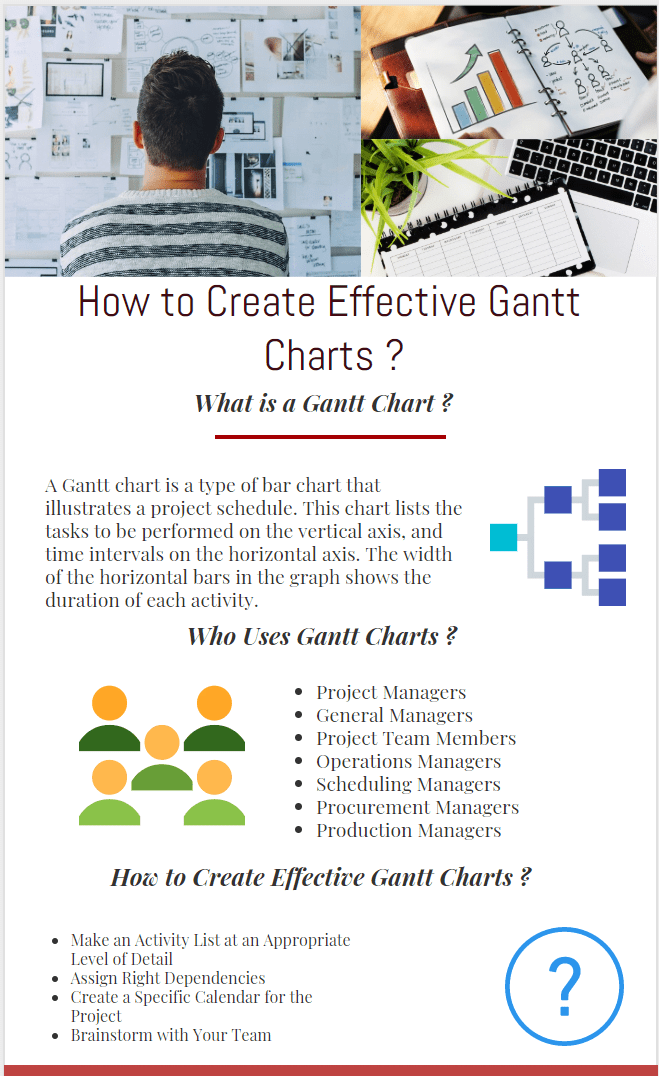
If you are working as a scheduler or a project control engineer, most probably you use the Gantt charts every day while creating a work schedule. If you are working out of the field of project management, most probably you have never heard of a Gantt. Simply put, Gantt charts are the visual tools that demonstrate a view of project activities scheduled over time. Gantt charts are the effective tools used for scheduling projects of all sizes. They help you to see which activity is scheduled to be done on a specific day. In this article, we will discuss how to create effective Gantt charts step by step.
Table of Contents
Creating and utilizing Gantt charts in Excel is a fundamental project management skill. This guide will integrate key phrases such as Monthly Gantt chart Excel template, Gantt chart Excel İndir, How to create Gantt chart in Excel, Gantt chart maker, Gantt chart template, Create Gantt chart, Gantt chart tool, and Online Gantt chart, emphasizing the process and resources available for effective project planning and tracking.
What is a Gantt Chart and What is it Used For?
Gantt charts are commonly used by project management teams to understand the current status and plan the future activities of the project. Most of the departments such as engineering, procurement, production, construction, etc. are managing their tasks, departmental works, responsibilities, and plans by gathering inputs provided by Gantt charts.
Gantt charts are specifically presented with dates at the top of the chart and a list of activities in the rows. Activities are presented as horizontal bars and the length of the bar shows the activity duration. The start point of the bar is the start date and the end point is the finish date. Gantt charts are usually created in Excel or even specialized project management software.
By using a Gantt chart, you can easily see;
- The project activities
- Start and end date of activities
- Duration of activities and project
Gantt Chart software tools like Primavera P6 and Microsoft Project enable to create Gantt Charts, calculate the critical path, and assign resources and relationships to activities. You can easily create the WBS (Work Breakdown Structure) and group the activities under WBS levels. Online Gantt Chart software tools which support collaborative project management are also available on the market.
Introduction to Gantt Charts in Excel
Gantt charts are a staple in project management, offering a visual timeline for project schedules. Excel, with its versatile functionality, serves as an excellent Gantt chart maker, allowing users to customize their project timelines. Whether you’re using a Monthly Gantt chart Excel template or starting from scratch, the process of creating a Gantt chart can be streamlined with the right approach.
Step-by-Step Guide: How to Create Gantt Chart in Excel
- Preparing Your Data: Begin by listing all project tasks with their respective start dates and durations. This initial step lays the groundwork for an effective Gantt chart tool within Excel.
- Choosing the Right Template: For those looking for a quick start, Gantt chart templates in Excel are readily available. These templates provide a structured format, making it easier to visualize the project timeline.
- Customization and Usage: Once your data is in place, or if you’ve chosen a Monthly Gantt chart Excel template, customization is key. Adjusting colors, labels, and dates personalizes your chart, aligning it with project specifics.
Advantages of Using an Excel-Based Gantt Chart Maker
Excel’s flexibility as a Gantt chart maker lies in its customization capabilities. From adjusting timelines in a Monthly Gantt chart Excel template to adding specific milestones and dependencies, Excel allows for detailed project management.
Exploring Gantt Chart Excel İndir Options
For users seeking specific designs or functionalities, Gantt chart Excel İndir (download) options are available online. These downloadable templates range from simple Monthly Gantt chart Excel templates to more complex versions, catering to varied project needs.
Utilizing Online Gantt Chart Tools
While Excel is robust for creating Gantt charts, Online Gantt chart tools offer additional functionalities such as real-time collaboration and integration with other project management software. These Gantt chart tools can complement Excel, especially for teams requiring collaborative capabilities.
1: Set Up Your Project Data
- Open Excel: Start a new spreadsheet.
- Input Data: In Column A, list all the tasks involved in your project. In Columns B and C, input the respective start dates and durations (in days) of these tasks.
2: Insert a Stacked Bar Chart
- Select Data: Highlight your data range, including task names, start dates, and durations.
- Insert Chart: Go to the Insert tab, click on Bar Chart, and choose Stacked Bar.
3: Convert to Gantt Chart
- Remove Start Date Series: Click on the start date bars in the chart, right-click, and select Format Data Series. Under Fill, choose No fill to hide the start date bars.
- Adjust Bar Spacing: Right-click on the bars, select Format Data Series, and adjust the Gap Width to make the Gantt bars thicker or thinner based on your preference.
4: Format the Gantt Chart
- Change Colors: Click on the duration bars in the chart to select them. Right-click, choose Format Data Series, and select Fill to choose a new color.
- Add Task Names: Click on the chart, then on the + sign on the top right corner. Check the Data Labels box. Click on Data Labels, select More Options, and then choose Category Name. Uncheck Value.
- Format Axis: To set the project’s start date, right-click on the horizontal (date) axis, and choose Format Axis. Adjust the Minimum bound to match your project’s start date, formatted as a date.
5: Customize Your Gantt Chart
- Add Milestones: You can add milestones by inserting additional data series into your Gantt chart or by manually adding shapes to mark significant events.
- Adjust Date Format: Right-click the horizontal axis, select Format Axis, and choose Number. Select a date format that suits your project timeline.
6: Final Touches
- Title and Legends: Add a chart title and remove the legend if it’s not necessary. You can do this from the Chart Elements button (+) on the top right of the chart.
- Gridlines and Labels: Adjust or remove gridlines for clarity. Ensure all task labels are readable and adjust their position if needed.
Who Uses Gantt Charts?
Almost everyone working in the field of project management and control use Gantt Charts to schedule project tasks. Individuals can also use Gantt charts to plan and visualize their tasks. If you use a software tool, it will do all the difficult work with the help of computer algorithms. Therefore you just insert tasks, durations, resources, and the software creates the schedule instantly for you.
Gantt charts are the visual tools for these people;
- Project Managers
- General Managers
- Project Team Members
- Operations Managers
- Scheduling Managers
- Procurement Managers
- Production Managers
Using the Gantt Charts in an effective manner necessitates training in project management, estimation methods, critical path analysis, and resource-leveling.
How to Create Effective Gantt Charts Step by Step?
Below tips can be helpful to create effective Gantt charts.
1. Make an Activity List at an Appropriate Level of Detail
Task lists should be created at an appropriate level of detail in order to monitor their performance efficiently. If there is too much detail, it will be difficult to create and update the chart regularly. On the other hand, if the detail level is too less, the Gantt chart can not represent adequately the real conditions and phases of the project.
Simply put, the detail level of activities must represent the real nature of work.
2. Assign Right Dependencies
Dependencies are the logic links between the activities. In general, there are four dependency types between the activities:
- Finish to Start (FS)
- Start to Start (SS)
- Finish to Finish (FF)
- Start to Finish (SF)
The only possible way of determining the critical path of a project is to assign the right dependencies between the activities. These dependencies should be clearly represented on the Gantt chart so that the project management team can easily recognize the critical path and make sure those activities are completed on time.
3. Create a Specific Calendar for the Project
Weekends, public holidays, and non-work days should be specified while creating a Gantt Chart. Calendars are dependent on the client, and if the client has definite time constraints, make sure that the time constraints are clearly marked on the Gantt Chart. If your project is extending to years, you may define the timescale of your Gantt Chart in terms of months. The timescale of short-term projects can be defined in terms of weeks or days.
4. Brainstorm with Your Team
It is a good way to conduct a brainstorming session for the chart with your team to ensure you have not missed out on anything important. If you analyze the estimations for activities, activity dependencies, and the critical path of the project with your team, the schedule will be more realistic and effective.
Also, share the Gantt chart with key stakeholders and receive their feedback before submitting it to the client.
Summary
Gantt charts build bridges between management teams, project managers, clients, and stakeholders. They are applicable to different types of projects such as construction, engineering, military, manufacturing, infrastructure, and IT. They help you to view the start and end dates of all project activities in one simple view. Resources in charge of each activity can be clearly represented, dependencies for each activity can be marked and time constraints can be visually presented with the help of Gantt Charts. From this point of view creating effective Gantt charts establishes effective communication channels between the parties.
In this article, we discuss Gantt Charts and the tips to create effective ones. If you have anything to share or add, you can do it through the comments box.
See Also
Advantages and Disadvantages of Gantt Charts
External References

Linda Maltz is vice president of design and consulting at Cuboca, a project management training and consulting organization specializing in construction management and BIM. She is certified Primavera P6 Trainer.




Gantt chart is a timeline that illustrates how the project will progress during the project management process.