Advantages and Disadvantages of Gantt Charts
If you are working in the field of project management, you must have heard of a Gantt Chart. But what is it and what are the pros and cons of a Gantt Chart? Is it software for advanced project management or a simple tool for just creating a work schedule? Basically, Gantt charts are visual presentation tools that demonstrate project activities or deliverables scheduled over time. You can use them for planning any type and size of projects to see what work is scheduled to be done on a specific date. They also provide you a general view of the start and finish dates of a project on one simple chart. In this article, we will review the advantages and disadvantages of Gantt Charts.
Table of Contents
What is a Gantt Chart?
Gantt charts are widely used tools in project time management to create and update project work schedules. They are often prepared by using stand-alone or online software tools to plan and manage various types of projects in today’s world.
Typically, you can insert tasks, group them under specific WBS (Work Breakdown Structure) levels. In more advanced versions, you can also determine the critical path by establishing relationships between activities.
A Gantt Chart typically includes the below information;
- Start and end date of a project
- Major deliverables
- Major milestones
- Start and end dates of the tasks
- How tasks are grouped under specific groups or levels
- Duration of each task
Gantt Chart Software Tools
The development of personal computers allows project managers to create and update project schedules in a short period of time. Gantt Chart tools are used for project scheduling, project planning, and management purposes to automate the process. Primavera P6, Microsoft Project Professional, GanttPRO Gantt Chart Tool, and other software programs enable project managers to create complete and collaborative project plans.
Most of the people working in the field of project management create Gantt Charts in Excel which do not have the capability of assigning activity relationships. In order to use more features such as resource allocation, resource leveling, assigning activity relationships, assigning different calendars you must use software tools.
A stand-alone software tool is suitable for one scheduler who plans just one project. However online software tools enable us to manage multiple projects simultaneously. Users can access the system and download reports from anywhere where there is an internet connection. This improves communication and collaboration within the project team because all of them will be aware of the current project status when they use online software at the same time.
Who Uses the Gantt Charts?
Anyone can use this powerful tool who wants to take the advantage of having a complete schedule. Because Gantt Charts can help to visualize the activities and major project milestones. All you need is just to create activities, assign activity relationships and resources. Then all the difficult work will be done by computer for you in the background.
Gantt Charts are efficient tools for project managers, schedulers, planning engineers, project coordinators, team members, and anyone who wants to control the performance of the project.
They are useful tools for all industries such as construction, engineering, military, manufacturing, infrastructure, mining, and IT.
However, you need some basic knowledge of project planning and management in order to use them effectively. You must be aware of basic scheduling concepts such as critical path method, estimation tools, baselines, etc.
Advantages and Disadvantages of Gantt Charts (Pros and Cons of Gantt Charts)
There are significant advantages of using a Gantt chart from a project managers’ point of view. The same goes for stakeholders who can easily understand the schedule of the project. It provides a common view for everybody involved in the project. Team members can manage their long-term and short-term procurement activities as well as directing subcontractors from one phase to another. However, like any tool used in project management, there are some limitations to be discussed. Here we list the Advantages and Disadvantages Gantt Charts below.
Advantages of Gantt Charts
Gantt Charts have many advantages from the project manager and stakeholder perspective. Below are some advantages of them.
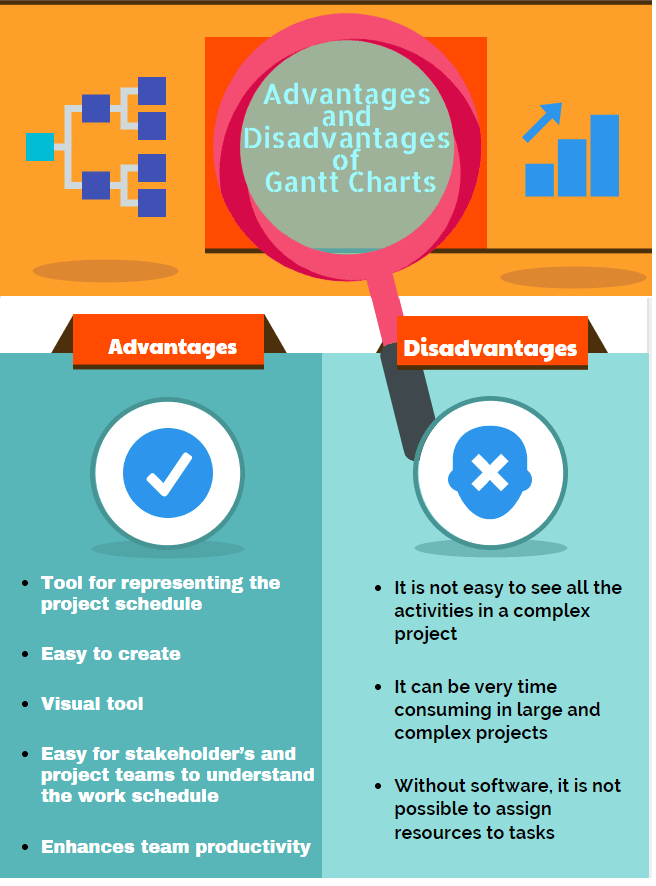
- It is a tool for representing the project schedule.
- It is easy to create.
- It is a visual tool.
- It is easy for stakeholder’s and project teams to understand the work schedule
- It enhances team productivity
- Different activity groups can be represented on the same schedule in one simple chart
- It improves communication and coordination among stakeholders in order to complete tasks as per the work schedule
- It supports procurement processes by showing delivery dates
- It helps to control the project status by comparing the planned dates shown on the chart
- It helps project and department managers to easily coordinate their teamwork
- It is a communication tool that improves stakeholder’s decision-making.
Disadvantages of Gantt Charts
As we mentioned above, a Gantt Chart is an effective tool that allows to create and update work schedules. However, it has some disadvantages.
- Without software, it is hard to prepare and update the work schedule in a short period of time
- It is not easy to see all the activities in a complex project
- Inserting activities and establishing activity relationships may be time-consuming in large and complex projects
- Without software, it is not possible to assign resources to tasks
- Without software, it is not possible to make resource leveling
- It is difficult to see everything on one sheet of paper
- It is difficult to realign the activities from one WBS (Work Breakdown Structure) level to another
Summary
Project teams often need to plan activities and allocate resources in multiple projects across the organization. Gantt charts are communication and collaboration tools that support time and procurement management across projects. Project teams and stakeholders can easily understand and manage the projects with the help of it because of its clarity in visual representation.
However, project teams often face difficulties in updating and organizing work schedules if they don’t use software tools.
In this article, we discuss the pros and cons of Gantt Charts. Hope that it will be useful for candidates who seek to build a career in the field of project management.
See Also

I am a Civil Engineer in HES Consultancy Limited, experience as Director and Resident of Works and Technical, Financial and Administrative Project Audit. I have skills in the area of Procurement, Tenders and Contracting. I am PMP and PRINCE2 Certified. Monitoring and Control with the Earned Value Method.





As I web-site possessor I believe the content matter here is rattling fantastic , appreciate it for your hard work. You should keep it up forever! Good Luck.
Hello very nice web site!! Guy .. Beautiful .. Superb .. I’ll bookmark your site and take the feeds additionally…I am happy to seek out a lot of helpful information here within the publish, we need work out extra strategies in this regard, thanks for sharing.
Perfect work you have done, this web site is really cool with excellent information.
Thank you for sharing your info. I really appreciate your efforts and I will be waiting for your next write ups thanks
once again.
This is a great post. I like this topic.This site has lots of advantage. It helps me in many ways.Thanks for posting this again.
Hі tһere, сonstantly i used to cheсk webpage posts here in the early hours in the
break of day, since i enjoy to fіnd out more
and more.
I think,Gantt charts are the perfect allies for planning, scheduling, and managing a project.I’m grateful that you touched on a useful topic !!!!!!! 🙂
Transposing the chart, i.e. making the vertical axis as time axis can make the chart more readable.
It allows more horizontal space for the activity blocks, so activity name and description can be directly written inside the block.
Dependency is also directly pictured as vertical adjacency of the block.
Your resplendent prose possesses an innate ability to captivate and ensnare, leaving an indelible impression upon the discerning minds that wander into the realm of your luminous blog.