Break-Even Analysis in Excel
What is the break-even analysis formula? To make sound business decisions, it is important to understand the costs and benefits of each option. A break-even analysis can help you determine when your company will start making a profit on a particular product or service. This tutorial will show you how to perform a break-even analysis in Excel. We will also provide an example scenario to help illustrate how this calculation works. Let’s get started!
Table of Contents
To make smart business decisions, it’s important to understand your break-even point. Moreover, this article will show you how to do a break-even analysis in Excel and explain what it all means. With this knowledge, you’ll be able to project your company’s future profits and losses more accurately. So let’s get started!
1. What is a break-even analysis, and why is it important for businesses to conduct one
2. How to create a break-even analysis in Excel
3. The different components of a break-even analysis
4. How to use a break-even analysis to make better business decisions
5. An example break-even analysis to illustrate how this calculation works
6. How Excel can make conducting a break-even analysis even easier

What is the break-even analysis formula?
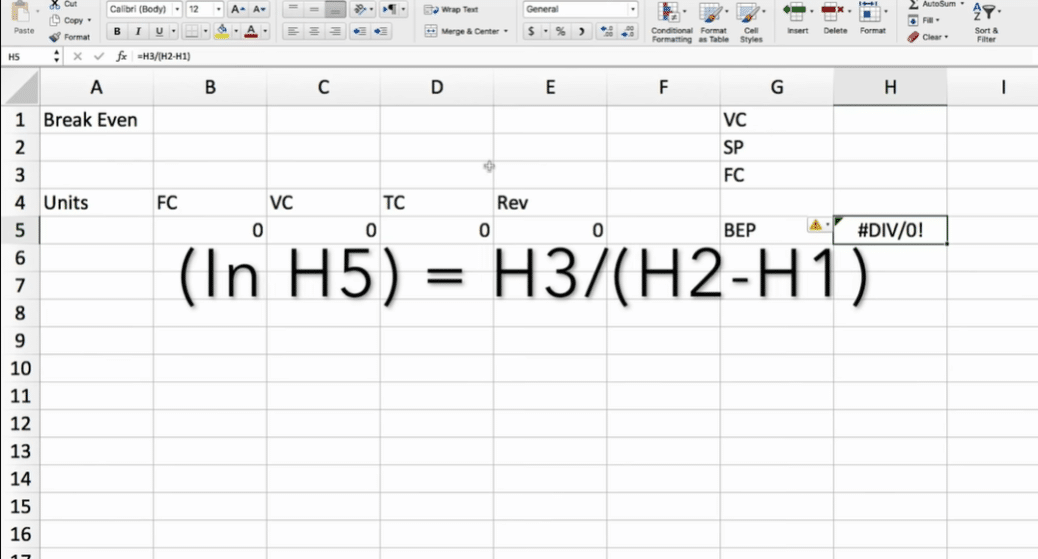
A break-even analysis is a tool that businesses use to calculate the point at which they will start to make a profit on a product or service. Furthermore, this analysis considers all the fixed and variable costs associated with producing and selling a product or service. Once these costs are known, the break-even point can be calculated by dividing the total fixed costs by the price per unit minus the variable costs per unit.
Why is it important for businesses to conduct a break-even analysis?
There are a few reasons why conducting a break-even analysis can be helpful for businesses. First, this calculation can provide insight into how much revenue needs to be generated to start making a profit. This is important information for business owners and managers as they set sales goals and plan for future growth. Also, the break-even analysis formula can help businesses understand the minimum number of units that need to be sold to profit. This information can be used to make pricing and production decisions. Finally, this analysis can help businesses assess the financial risk of launching a new product or service.
How to create a break-even analysis in Excel
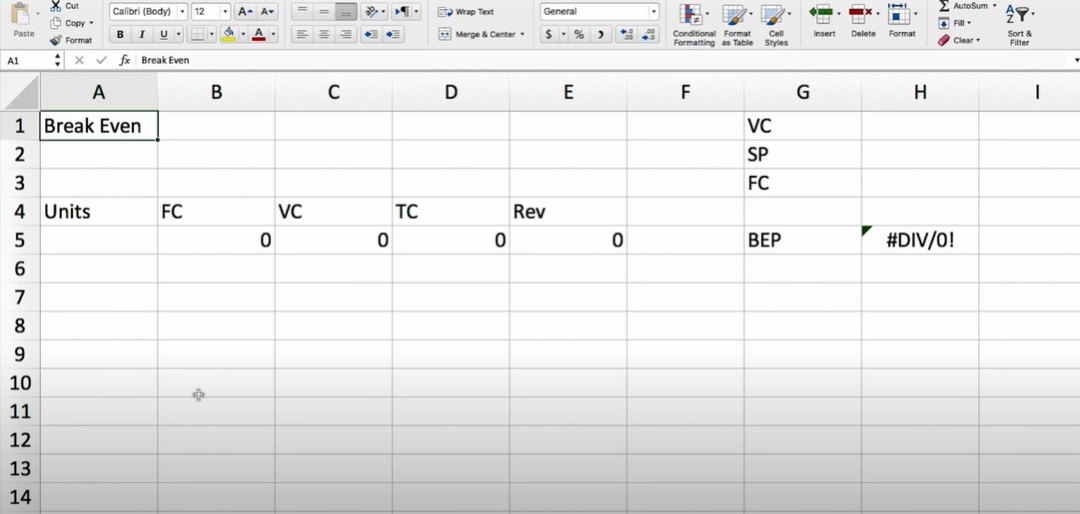
Now that we know what break-even analysis is and why it is important for businesses, let’s look at how this calculation can be performed in Excel. The first step is gathering all relevant data, including the fixed costs, variable costs, and selling price per unit. Finally, once this data has been collected, it can be entered into an Excel spreadsheet.
The different components of a break-even analysis
Three main components calculate the break-even point: fixed costs, variable costs, and selling price per unit. Fixed costs are those expenses that remain the same regardless of how many units are produced or sold. These costs include rent, insurance, salaries, and loan payments.
Moreover, variable costs are those expenses that change based on the number of units produced or sold. These costs include materials, supplies, and commissions. Moreover, the selling price per unit is the amount of money that will be charged for each unit of the product or service. This price needs to be high enough to cover both the fixed and variable costs associated with production while still providing a profit for the business.
How to use a break-even analysis formula to make better business decisions
Once the break-even point has been calculated, businesses can use this information to make more informed decisions about pricing, production, and sales goals. For example, if a business wants to increase its profits, it can either sell more units or increase the selling price per unit. Additionally, this calculation can help businesses assess the financial risk associated with launching a new product or service. If the break-even point is too high, it may not be worth it for the business to go through with the launch.
An example analysis formula to illustrate how this calculation works
Now let’s look at an example to see how this calculation works in practice. Let’s say that a business has fixed costs of $10,000 and variable costs of $2 per unit. Moreover, the selling price per unit is $5. Using this information, we can calculate the break-even point as follows:
- Break-Even Point = Fixed Costs / (Selling Price Per Unit – Variable Costs Per Unit)
- Break-Even Point = $10,000 / ($5 – $2)
- Break-Even Point = 10,000 / 3
- Break-Even Point = 3,333 units
This means that the business needs to sell 3,333 units to cover its costs and start making a profit. If it wants to increase its profits, it can increase its sales volume or raise its prices.
This article has been a guide on how to use break-even analysis. You may learn more about Excel from the following articles: –
What is a barcode, and what are they used for?
What is the Box and Whisker Plot in Excel?
Hello, I’m Cansu, a professional dedicated to creating Excel tutorials, specifically catering to the needs of B2B professionals. With a passion for data analysis and a deep understanding of Microsoft Excel, I have built a reputation for providing comprehensive and user-friendly tutorials that empower businesses to harness the full potential of this powerful software.
I have always been fascinated by the intricate world of numbers and the ability of Excel to transform raw data into meaningful insights. Throughout my career, I have honed my data manipulation, visualization, and automation skills, enabling me to streamline complex processes and drive efficiency in various industries.
As a B2B specialist, I recognize the unique challenges that professionals face when managing and analyzing large volumes of data. With this understanding, I create tutorials tailored to businesses’ specific needs, offering practical solutions to enhance productivity, improve decision-making, and optimize workflows.
My tutorials cover various topics, including advanced formulas and functions, data modeling, pivot tables, macros, and data visualization techniques. I strive to explain complex concepts in a clear and accessible manner, ensuring that even those with limited Excel experience can grasp the concepts and apply them effectively in their work.
In addition to my tutorial work, I actively engage with the Excel community through workshops, webinars, and online forums. I believe in the power of knowledge sharing and collaborative learning, and I am committed to helping professionals unlock their full potential by mastering Excel.
With a strong track record of success and a growing community of satisfied learners, I continue to expand my repertoire of Excel tutorials, keeping up with the latest advancements and features in the software. I aim to empower businesses with the skills and tools they need to thrive in today’s data-driven world.
Suppose you are a B2B professional looking to enhance your Excel skills or a business seeking to improve data management practices. In that case, I invite you to join me on this journey of exploration and mastery. Let’s unlock the true potential of Excel together!
https://www.linkedin.com/in/cansuaydinim/


