Primavera P6 Resource Curves Explained
Do you know how to generate different types of resource curves in Primavera P6? Basically, resource curves are used to model the resource or cost distribution of an activity within the project schedule. Depending on the distribution type, resource curves can be linear, back loaded, front-loaded, trapezoidal, triangular, etc. If you have an activity with a non-linear resource loading, it is possible to create a custom resource curve to model its resource distribution. In this article, we will demonstrate how to create and assign custom resource curve by using Oracle Primavera P6 Resource Curves feature.
Table of Contents
Why Do We Use Primavera P6 Resource Curves ?
In a work schedule, if the resource loading or cost loading of an activity is not uniform, resources curves can be used to represent the real distribution. For example let’s say that you have one activity for bricklaying and you are sure that at the beginning, your productivity will be less, in the middle productivity will be more and at the end, the productivity will again be less. In order to model real resource loading, in Primavera P6, you can select the trapezoidal resource curve instead of linear.
How to Generate Different Types of Resource Curves in Primavera P6?
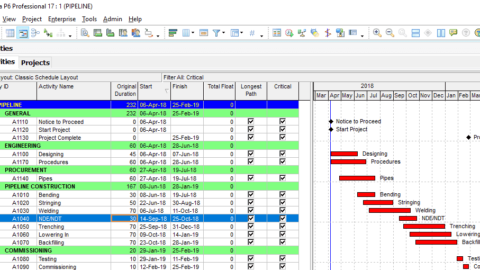
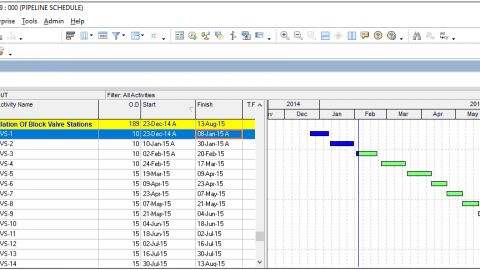
Let’s assume that you have a sample pipeline schedule. All the activities Clearing and Grading, bending, stringing, welding, etc. are logically tied. (Figure 1).
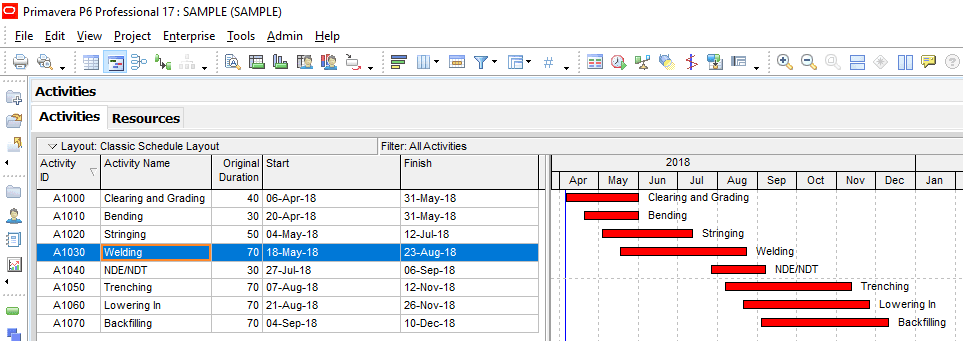
Primavera P6 Resource Curves – Figure 1 Sample Pipeline Schedule
And you assigned a “Manhour” labor resource to each of the pipeline activities. (Figure 2).
If you don’t know how to assign a resource in Primavera P6, please read this article. Primavera P6 Resources
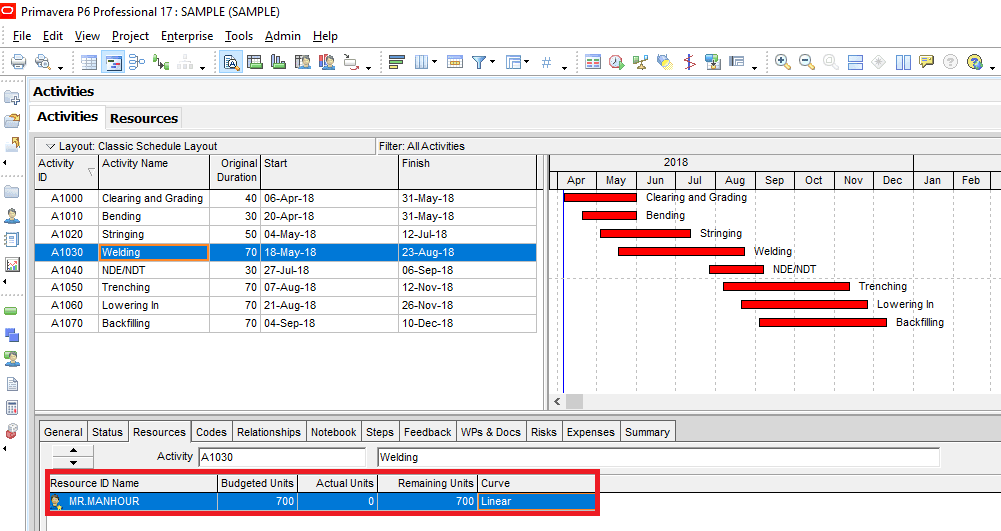
Primavera P6 Resource Curves – Figure 2 Manhour Resource
Select Enterprise | Resource Curves from the main drop-down menu at the top of the screen. This will display the Resource Curves window. (Figure 3)
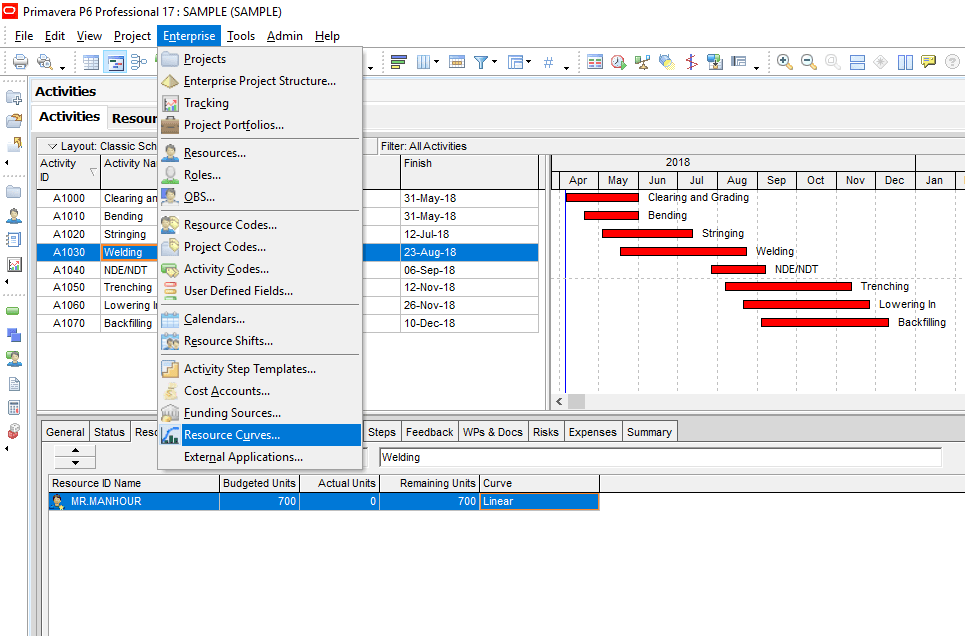
Primavera P6 Resource Curves – Figure 3 Primavera Resoruce Curves
In the Resource Curves window click “Add” button and select a resource curve template to create your custom curve. (Figure 4)
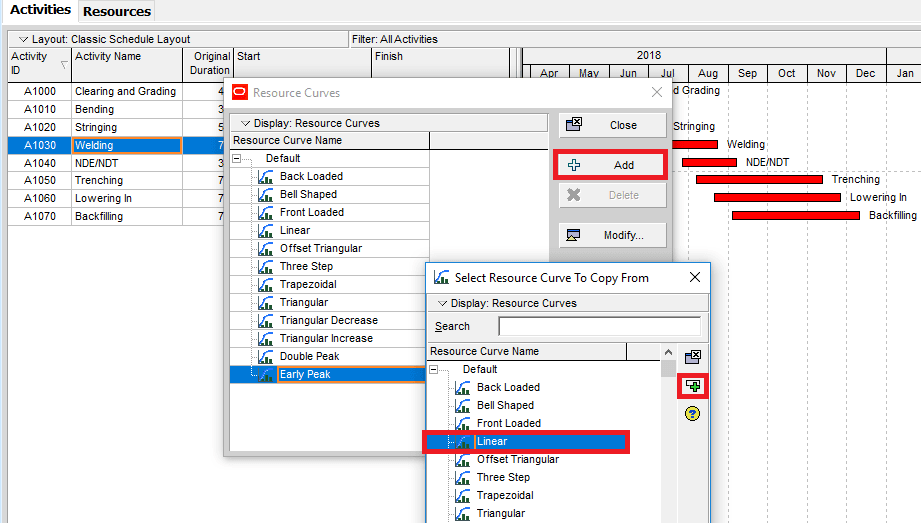
Primavera P6 Resource Curves – Figure 4 Resource Curves Window
Then, type the new resource curve name as “Welding Curve” and click the “Modify” button to customize. (Figure 5)
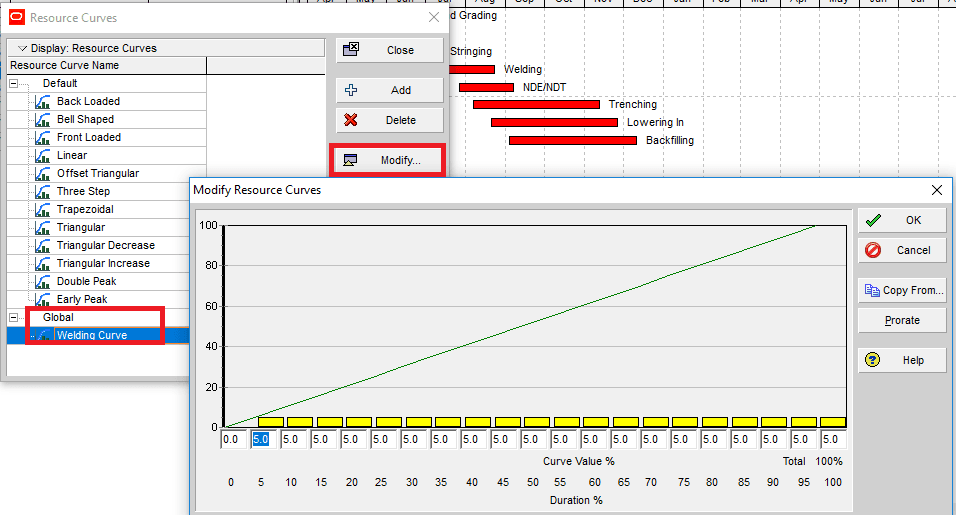
Figure 5 Welding Curve
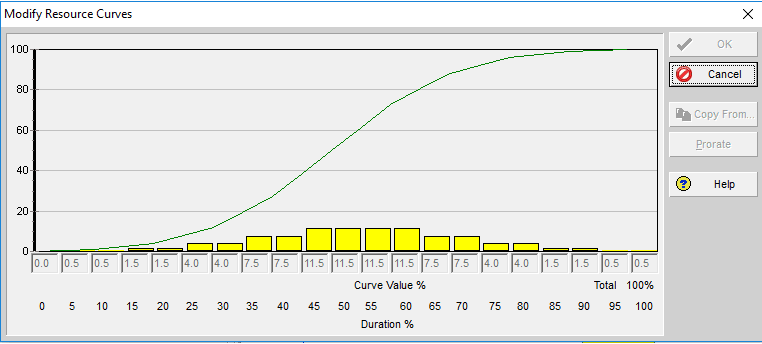
The modify resource curves window allows you to determine a ‘curve value %’ for every ‘duration %’ increment of 5 from 0 to 100. In this example, we fill in uniform resource loading for the last four duration period. (Figure 6.)
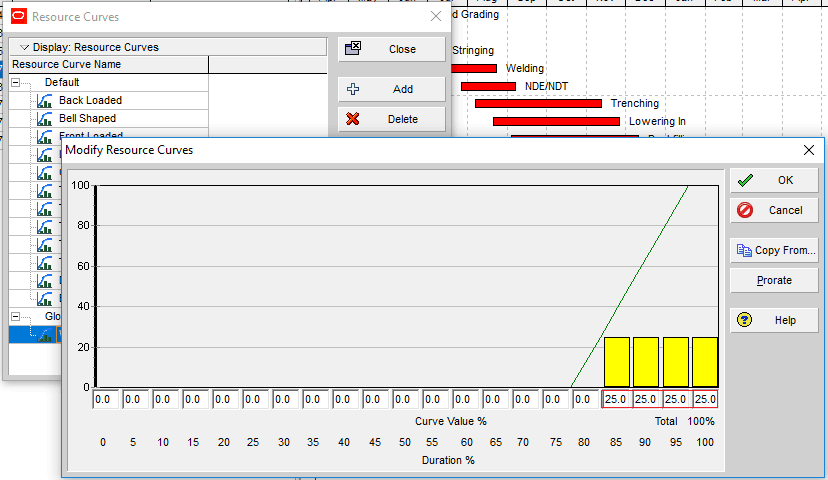
Figure 6 Customizing Resource Curve
Now close the resource curves window and assign the newly created “Welding Curve” to the welding activity. (Figure 7.)
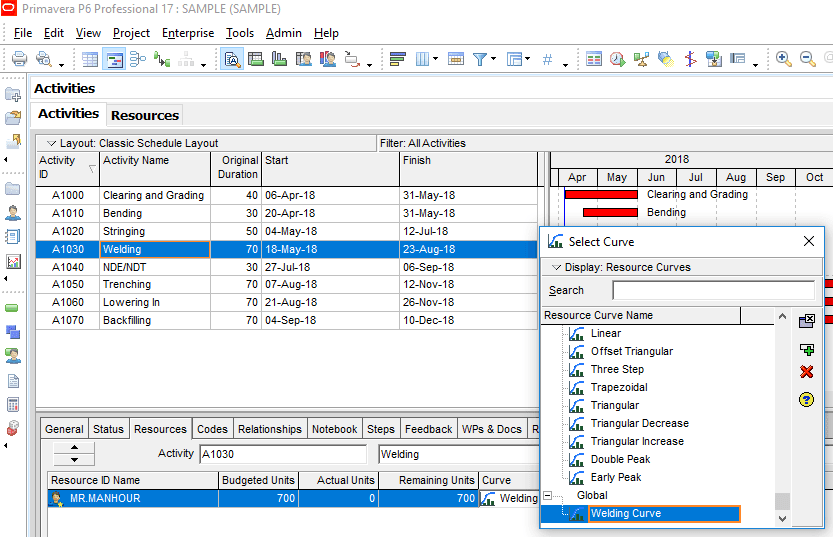
Figure 7 Assigning Resource Curve
Figure 8 displays the resource usage profile of the welding activity. As it is seen from the figure that resource distribution of the welding activity is not uniform. It demonstrates the resource distribution of our customized curve.
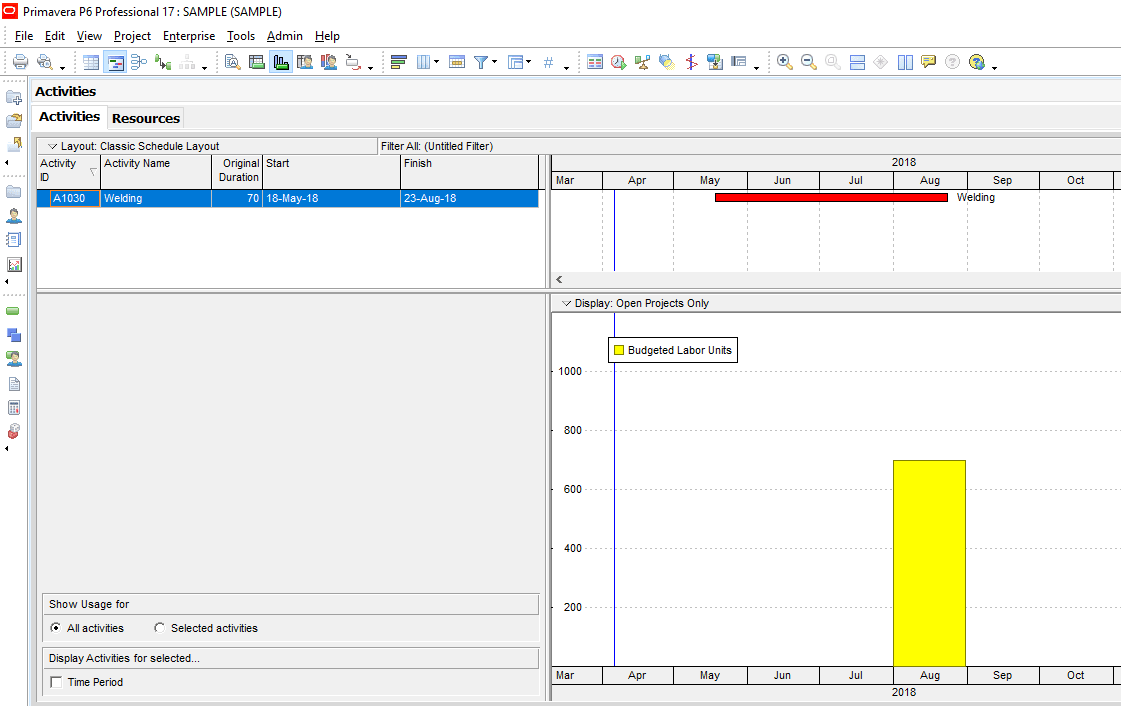
Figure 8 Resource Usage Profile
Summary
Resource Curves feature offers several default curves for representing the resource loading of an activity. There are twelve default resource curves defined in the application. [1] It is possible to create a specific resource curve. It is a flexible tool enables you to create your projects custom resource loading tables and analyze them in detail. In this article, we demonstrate creating and assigning different types of resource curves in Primavera P6. Hope that it will be useful for you while creating your project schedule.
References
[1] docs.oracle Defining Resource Curves
See Also

Irma Gilda is chief executive of Sonic Training and Consultancy Co., the training platform offers project planning and scheduling More than 60 k learners have used the platform to attain professional success. Irma is a professional Primavera P6 Trainer.

