How to Create an Excel Gantt Chart: All Methods Together!
Embarking on the journey of project management requires the right tools at your disposal, and there’s nothing quite as quintessential as a Gantt chart template. This indispensable tool not only simplifies the visualization of project timelines but also enhances the overall planning and tracking process. Whether you’re looking to create a Gantt chart online or prefer a downloadable template to customize in Excel, understanding how to leverage this powerful tool can significantly impact your project’s success from the get-go.
Table of Contents
In this article, crafted with care by the folks at projectcubicle.com, we will explore the steps to create a Gantt chart in Excel, using both Gantt chart templates and from scratch methods. We’ll also delve into the benefits of using a Gantt chart maker and how to enhance your Gantt charts with additional features. Whether you are a beginner or an advanced user, you will find valuable insights and tips to make your Gantt charts more effective and visually appealing.
Spread the word, share this article, and let’s help everyone become project management superheroes with the best Gantt chart templates and tools at their fingertips!
What Are Gantt Charts: Understanding Gantt Charts
The beauty and effectiveness of a Gantt chart lie in its ability to transform complex project information into a clear, visual timeline. With this powerful visualization, project managers can easily monitor the progress of tasks against the planned schedule. It’s this clarity that enables managers to identify potential bottlenecks or delays early on, allowing for timely interventions to keep the project on track. The advent of Gantt chart Excel templates and Gantt chart makers has further simplified the creation process, making these charts accessible to not just experienced project managers but also to novices in the field.
Benefits of Gantt Charts
- Visual Clarity: Gantt charts provide a clear project timeline.
- Enhanced Planning: They detail task start/end times and durations.
- Resource Management: Gantt charts help allocate resources effectively.
- Improved Communication: They enhance team and stakeholder communication.
- Progress Tracking: Gantt charts enable real-time task progress tracking.
Advantages and Disadvantages of Gantt Charts – projectcubicle
Gantt Charts vs. PERT Charts
- Complexity and Detail: Gantt charts are simpler and focus on task durations and dependencies. In contrast, PERT charts are more complex, ideal for projects where task durations are uncertain and the focus is on identifying the critical path.
- Visualization: Gantt charts are visually straightforward, making them accessible to all project stakeholders. PERT charts, using a network model, might require more explanation.
- Flexibility in Updates: Gantt charts are easier to update with changes in task schedules, while PERT charts might need significant adjustments due to their focus on task dependencies and critical paths.
Gantt Charts vs. Kanban Boards
- Project Overview vs. Task Management: Gantt charts provide a macro view of the project timeline, while Kanban boards are more about managing individual tasks and their progress through different stages.
- Static vs. Dynamic: Gantt charts are relatively static, offering a snapshot of the project plan. Kanban boards are dynamic, with tasks moving across the board as work progresses.
- Suitability: Gantt charts are suited for projects with a clear sequence and fixed timelines. Kanban boards are ideal for ongoing projects or tasks with variable timelines.
In summary, Gantt charts are more than just a project management tool; they are a testament to the enduring importance of clear visualization in effective project planning and execution. Whether through a Gantt chart Excel template, a specialized Gantt chart maker, or an online platform, these charts continue to be a fundamental component in the success of projects across industries. Also, understanding the history, significance, and practical applications of Gantt charts is essential for anyone looking to excel in project management.
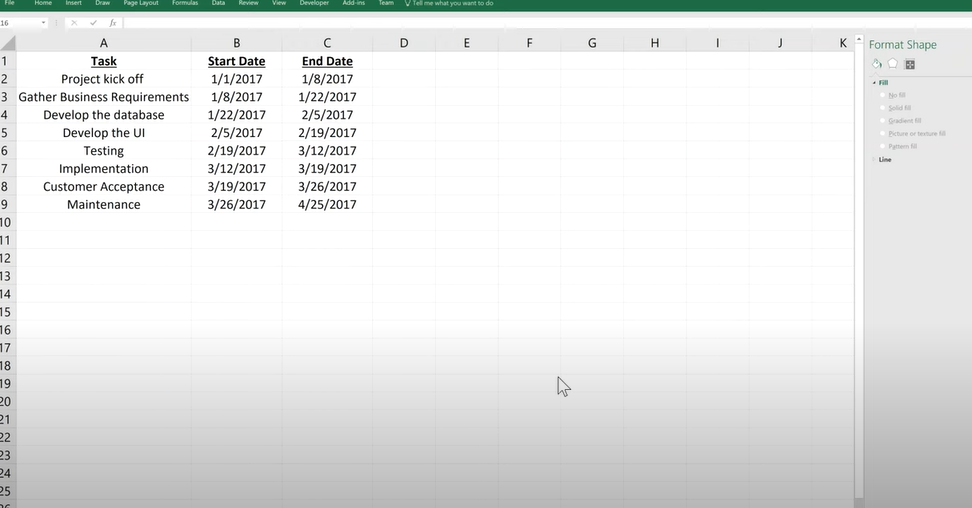
Start with a table listing all your project tasks along with their respective start dates and durations.
Where is Gantt Chart Used?
Gantt charts are versatile tools that transcend various fields, industries, and project types due to their intuitive design and effective project visualization capabilities. Also, here’s a comprehensive look at where Gantt charts are commonly used:
- Construction project management
- Software development
- Event planning and management
- Marketing campaign planning
- Manufacturing process planning
- Research project planning
- IT project management
- Educational project planning
- Healthcare project management
- Product development
- Human resources project tracking
- Consulting project management
- Engineering project planning
- Government project management
- Real estate development
- Supply chain and logistics planning
- Media production scheduling
- Retail project management
- Financial planning and analysis projects
- Customer service improvement projects
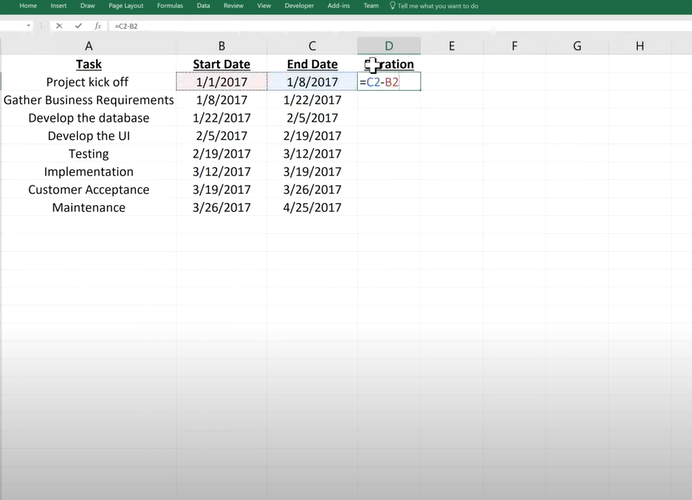
Select your data (excluding the Task Name column).
Navigate to the Insert tab on the Ribbon.
Click on Bar Chart and choose Stacked Bar.
How To Create A Simple & Effective Gantt Chart In Excel?
Creating a Gantt chart in Excel can transform your project management by offering a clear visual timeline of your project’s tasks and milestones. Let’s break down the process step by step, including examples and even a bit of Excel code (formulas) to automate some parts of the process. Also, this guide is designed to help you effortlessly create Gantt charts, whether you’re using a monthly Gantt chart Excel template, starting from scratch, or leveraging online tools for enhanced collaboration.
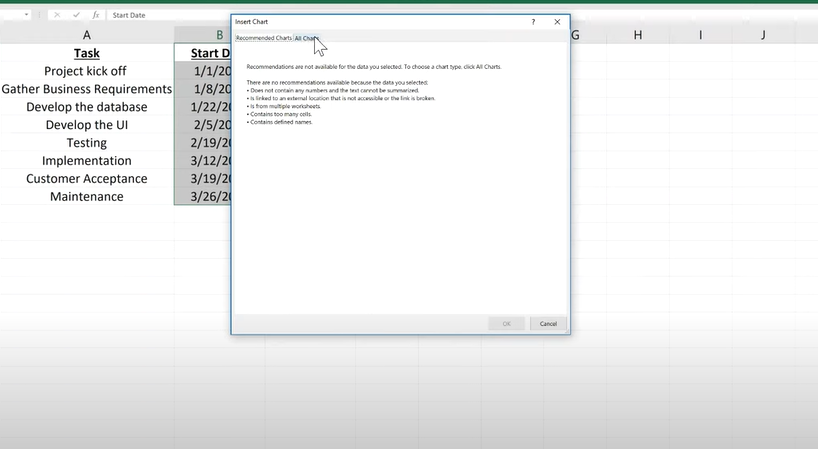
After inserting the chart, right-click on it and choose Select Data. You’ll need to add your tasks as a new series. For Series name, select your Task Names. For Series values, clear any selected range and manually enter your task durations. D2, A2<>
Are Gantt charts better than PERT charts?
Whether Gantt charts are better than PERT charts (Program Evaluation and Review Technique charts) depends on the specific needs of your project management scenario. Gantt charts provide a visual timeline for project tasks and are excellent for tracking the progress of activities against a planned schedule. Also, they are straightforward, making them accessible for most project teams and stakeholders to understand and follow. Gantt charts are particularly useful for projects where time management and task sequencing are critical.
On the other hand, PERT charts are more focused on depicting tasks, durations, and dependencies in a network diagram format. Also, they are invaluable for identifying the critical path of a project and analyzing task durations. This makes PERT charts better suited for projects where the emphasis is on completing the project in the shortest time possible or where the tasks have variable durations.
In summary, the choice between Gantt charts and PERT charts should be based on the project’s complexity, the manager’s preference, and the project’s specific needs regarding time management, task dependency analysis, and stakeholder communication.
Does Microsoft Excel come with a Gantt chart template built in?
As of my last update, Microsoft Excel does not come with a pre-built Gantt chart template included among its standard templates. However, Excel offers powerful charting capabilities that allow users to create Gantt charts from scratch using stacked bar charts. Additionally, there are many free and premium Gantt chart templates available online that are compatible with Excel. Also, these templates can be downloaded and customized within Excel, providing a quick and convenient starting point for creating Gantt charts.
How do you create a Gantt chart?
Creating a Gantt chart in Excel involves several steps:
- List your project tasks: Start by listing all the tasks involved in your project in one column.
- Define start dates and durations: In adjacent columns, specify the start date and duration of each task.
- Insert a stacked bar chart: Highlight your tasks, start dates, and durations, then insert a stacked bar chart from the Charts section in Excel.
- Format your chart: Adjust the bar colors and remove the fill for the series representing the start dates to leave only the duration visible, resembling the appearance of a Gantt chart.
- Customize your Gantt chart: Add additional details such as task dependencies, milestones, and critical paths by manually adjusting the chart elements and labels.
Can I make a Gantt chart for free?
Yes, you can make a Gantt chart for free using various tools and software. While Microsoft Excel is a popular choice for creating Gantt charts and is available to many users, there are also free online Gantt chart makers and project management tools that offer Gantt chart functionalities. Also, these free tools may have limitations compared to their paid counterparts but can be sufficient for basic project management needs. Some notable free tools include Google Sheets (using similar methods to Excel), Trello (with a Gantt chart power-up), and other free project management software options available online.
What Is Gantt Chart Excel Template?
A Gantt chart Excel template is a pre-formatted spreadsheet in Excel designed to help users quickly create Gantt charts. Also, these templates come with the necessary columns and chart elements configured, requiring users to input their project details.
Free Gantt Chart Template for Excel
Embarking on project management without the right tools can be like setting sail without a compass. Recognizing this, the innovative minds at Projectcubicle.com have sailed to the rescue, offering a treasure trove of resources tailored for the savvy project manager. Among these resources, their Free Gantt Chart Template for Excel stands out as a beacon for those navigating the complexities of project timelines and schedules.
Utilizing a Gantt chart is pivotal in the realm of project management, providing a visual timeline that outlines how a project will unfold over time. Also, the Gantt chart Excel template offered by Projectcubicle.com is not just any template; it’s a meticulously designed tool that caters to the needs of both novices and seasoned project managers alike. Also, simplicity and efficiency at its core, this template allows users to create Gantt charts with ease, ensuring project timelines are not only met but also clearly communicated to all stakeholders involved.
What’s more, projectcubicle.com doesn’t stop at offering a single template. Also, we provide an array of Gantt chart templates, including a monthly Gantt chart Excel template and a construction Gantt chart template designed to cater to various project durations and complexities. Whether your project spans a month, a quarter, or even a year, these templates offer the flexibility and detail needed to track your project’s progress meticulously.
Where Is Gantt Chart Excel?
A Gantt chart in Excel is not a pre-built feature but can be created using the stacked bar chart function. Alternatively, Excel-compatible Gantt chart templates can be found online and used within the Excel application.
How Much Is Gantt Excel?
Creating a Gantt chart in Excel is free when using its built-in chart features, requiring only access to Excel. Also, leveraging Excel’s capabilities, such as stacked bar charts, this method visually represents project timelines, milestones, and progress without additional costs.
Considering a third-party Gantt chart tool or add-in to enhance Excel’s functionality introduces variable costs. Also, these can significantly differ depending on the provider and the offered features’ complexity. Basic Gantt chart templates, often available for free, provide a solid starting point for straightforward project management needs.
FAQs on Creating and Utilizing Gantt Charts in Excel
Can I create a Gantt chart directly in Excel?
Yes, you can create a Gantt chart in Excel by using the stacked bar chart feature and customizing it to display your project’s tasks and timelines.
Do I need special software to create a Gantt chart in Excel?
No special software is required beyond Excel itself. However, you can enhance your Gantt charts with add-ins or templates designed specifically for Excel.
How can I add task dependencies in an Excel Gantt chart?
Task dependencies aren’t automatically shown in Excel Gantt charts. Also, you can manually indicate dependencies by adding arrows or lines in the chart or by using comments to note dependencies.
Hello, I’m Cansu, a professional dedicated to creating Excel tutorials, specifically catering to the needs of B2B professionals. With a passion for data analysis and a deep understanding of Microsoft Excel, I have built a reputation for providing comprehensive and user-friendly tutorials that empower businesses to harness the full potential of this powerful software.
I have always been fascinated by the intricate world of numbers and the ability of Excel to transform raw data into meaningful insights. Throughout my career, I have honed my data manipulation, visualization, and automation skills, enabling me to streamline complex processes and drive efficiency in various industries.
As a B2B specialist, I recognize the unique challenges that professionals face when managing and analyzing large volumes of data. With this understanding, I create tutorials tailored to businesses’ specific needs, offering practical solutions to enhance productivity, improve decision-making, and optimize workflows.
My tutorials cover various topics, including advanced formulas and functions, data modeling, pivot tables, macros, and data visualization techniques. I strive to explain complex concepts in a clear and accessible manner, ensuring that even those with limited Excel experience can grasp the concepts and apply them effectively in their work.
In addition to my tutorial work, I actively engage with the Excel community through workshops, webinars, and online forums. I believe in the power of knowledge sharing and collaborative learning, and I am committed to helping professionals unlock their full potential by mastering Excel.
With a strong track record of success and a growing community of satisfied learners, I continue to expand my repertoire of Excel tutorials, keeping up with the latest advancements and features in the software. I aim to empower businesses with the skills and tools they need to thrive in today’s data-driven world.
Suppose you are a B2B professional looking to enhance your Excel skills or a business seeking to improve data management practices. In that case, I invite you to join me on this journey of exploration and mastery. Let’s unlock the true potential of Excel together!
https://www.linkedin.com/in/cansuaydinim/





No time? Watch our video now: