What-If Analysis in Excel: How do you use what-if analysis in Excel?
Understanding What-If Analysis in Excel
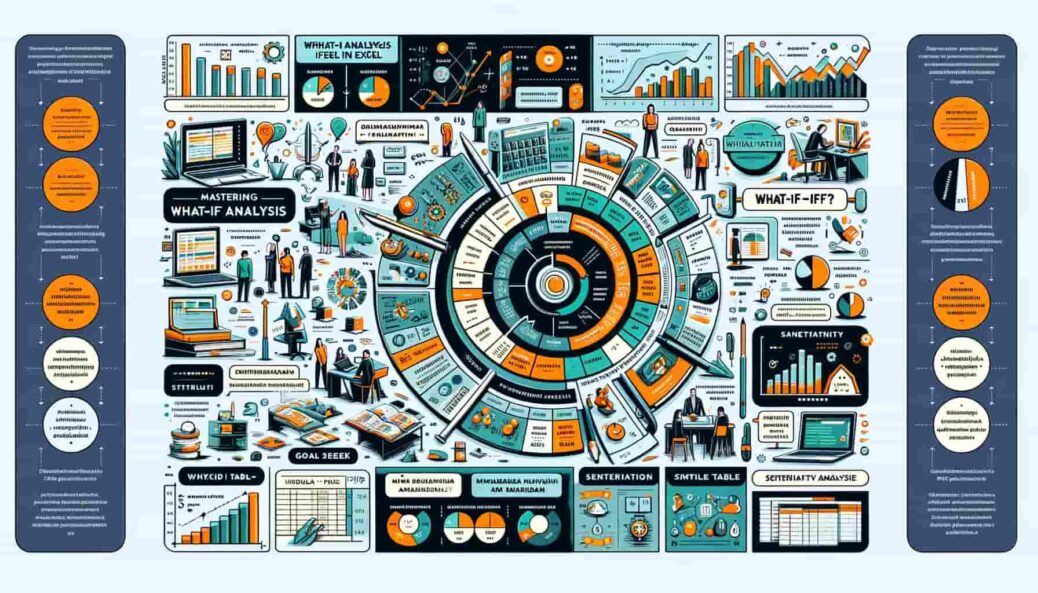
What-if analysis in Excel is a methodological approach that allows users to explore and evaluate the potential outcomes of different scenarios by manipulating variables within Excel models. This technique is invaluable for financial analysts, project managers, and business strategists who aim to forecast outcomes under various conditions and make decisions that steer them toward optimal results.
Table of Contents
Key Tools for What-If Analysis in Excel
Data Tables: A Gateway to Sensitivity Analysis
Data Tables offer a straightforward way to perform sensitivity analysis by changing one or two variables and observing the effects on one or more outcomes. For example, a financial analyst might use a Data Table to see how varying interest rates affect loan repayment schedules, providing a clear visualization of potential financial scenarios.
Scenario Manager: Visualizing Multiple Outcomes
Scenario Manager enables users to create and compare different financial and operational models. This feature is particularly useful for visualizing how various budget allocations or strategic decisions impact overall business metrics, facilitating robust strategic planning.
Goal Seek: Pinpointing Necessary Adjustments
Goal Seek Excel reverses the analysis process, starting with the desired outcome and determining the necessary adjustments to achieve that goal. It’s an excellent tool for finding out the required sales increase to achieve a set profit margin or the amount of cost reduction needed to reach financial targets.
What If Example
Scenario 1: Budget Forecasting Using Scenarios
Objective: To compare the financial outcomes under three different budgeting scenarios for the upcoming year: Optimistic, Pessimistic, and Realistic.
- Data Setup: Assume you have a basic budget model in Excel with variables for revenue, costs, and net income.
- Creating Scenarios:
- Go to “Data” > “What-If Analysis” > “Scenario Manager”.
- Create three scenarios named Optimistic, Pessimistic, and Realistic. For each scenario, vary the inputs for revenue and costs. For example, increase revenue by 10% and decrease costs by 5% for the Optimistic scenario.
- Viewing Results: Use the Scenario Manager to switch between scenarios and compare the impact on net income.
Scenario 2: Sales Analysis Using Data Tables
Objective: To understand how changes in unit price and units sold affect total sales.
- Data Setup: Create a simple model where you have a cell for unit price, a cell for units sold, and a cell for total sales (unit price * units sold).
- Creating a Two-variable Data Table:
- Set up your table so that different unit prices are listed down a column and different units sold across a row.
- On the “Data” tab, select “What-If Analysis” > “Data Table”. Choose the cell for total sales as the column input cell for unit prices and the row input cell for units sold.
- Interpreting Results: The Data Table will fill with values showing how total sales vary with changes in both unit price and units sold, providing a comprehensive view of potential sales outcomes.
Scenario 3: Determining Break-even Point Using Goal Seek
Objective: To find out how many units need to be sold to break even.
- Data Setup: Assume your Excel model calculates total profit based on units sold, fixed costs, and variable costs per unit.
- Using Goal Seek:
- Suppose your fixed costs are $1,000, variable cost per unit is $10, and the selling price per unit is $20.
- Go to “Data” > “What-If Analysis” > “Goal Seek”. Set the cell containing total profit to $0 (break-even point), by changing the cell containing units sold.
- Viewing Results: Goal Seek will iterate and provide the number of units that need to be sold to break even, allowing you to plan production and sales targets accordingly.
These examples demonstrate the versatility and power of Excel’s what-if analysis tools in providing actionable insights for decision-making. By applying Scenarios, Data Tables, and Goal Seek in these contexts, users can explore a variety of outcomes based on different assumptions, leading to more informed and strategic business decisions.
Solver: Optimizing Complex Scenarios
Solver goes beyond Goal Seek Excel by adjusting multiple variables simultaneously to achieve a desired outcome, dealing with constraints and optimizing the results. It’s particularly useful for complex decision-making scenarios, such as maximizing profit while minimizing costs across multiple product lines.
Implementing What-If Analysis: A Step-by-Step Approach
- Define Your Objective: Clearly identify what you’re trying to achieve or the question you’re attempting to answer.
- Select the Right Tool: Choose between Data Tables, Scenario Manager, Goal Seek Excel, or Solver based on the complexity of your analysis.
- Setup Your Model: Prepare your Excel model by identifying the input variables that will be manipulated and the outcome metrics you wish to evaluate.
- Run Your Analysis: Execute the analysis by altering the variables and observe the impacts on the outcomes.
- Evaluate the Results: Assess the outcomes to identify trends, insights, and the best course of action.
Real-World Applications and Examples of What-If Analysis in Excel
What-If Analysis in Excel transcends theoretical application, embedding itself into the core of various business operations. From financial forecasting to budgeting and operational efficiency, the practical applications of this tool are both diverse and impactful. Let’s delve into some expanded real-world examples to understand how What-If Analysis propels industries forward.
Financial Forecasting: A Closer Look at Market Dynamics
In the realm of financial forecasting, What-If Analysis serves as a cornerstone for evaluating potential changes in market conditions and their ramifications on investment portfolios. For example, by using Data Tables, analysts can visualize how a range of growth rates would affect the future value of investments, enabling investors to strategize around risk and return. This predictive modeling is crucial for crafting resilient investment strategies that can withstand unpredictable market shifts, ensuring that portfolios are not only optimized for current conditions but are also robust enough to navigate future uncertainties.
Budgeting: Strategic Planning with Scenario Manager
Budgeting is another critical area where What-If Analysis, particularly the Scenario Manager, plays a pivotal role. Organizations use Scenario Manager to explore various budgeting strategies and understand their potential impact on cash flow and financial health. By creating different budget scenarios—such as increased marketing spend, expansion plans, or cost-cutting measures—financial planners can assess the outcomes of these strategies on the organization’s bottom line. This approach facilitates informed decision-making, allowing companies to allocate resources more effectively and prepare for various financial futures. For instance, a business might simulate the financial outcomes of a significant capital expenditure, like acquiring new technology, to see how it would affect cash flow over time, enabling leaders to make data-driven decisions about major investments.
Operational Efficiency: Optimizing with Solver
The Solver tool in Excel is crucial for improving operational efficiency. It optimizes resource use in manufacturing, reducing costs and boosting efficiency. Solver manages complex scenarios, adjusting many variables to meet goals like cutting production costs while ensuring quality. It helps manufacturers find the best mix of materials, labor, and machinery. This maximizes output and lowers costs, respecting limits like capacity and material supply. Such analysis aids managers in strategic decisions, improving productivity and profits. For instance, Solver can refine production schedules, merging efficiency needs with maintenance and labor constraints. This ensures smooth, cost-effective manufacturing processes.
People Also Ask
How to do an if if statement in Excel?
The basic syntax of an IF statement is =IF(logical_test, value_if_true, value_if_false). For example, if you want to check if a sales figure in cell A1 is above 100 to classify it as “High”, the formula would be =IF(A1>100, "High", "Low"). This checks the condition (A1>100), and if true, returns “High”; if false, returns “Low”.
How to do the What If analysis?
What-If Analysis in Excel can be done using tools like Data Tables, Scenario Manager, and Goal Seek Excel:
- Data Tables: Allow you to change one or two variables and see how it affects the outcome. Found under “What-If Analysis” in the Data tab.
- Scenario Manager: Enables you to create and save different groups of values (scenarios) and switch between them. Also found under “What-If Analysis”.
- Goal Seek Excel: Lets you find the necessary input value to achieve a desired outcome by changing one variable. Accessible from “What-If Analysis”.
How to do Data Analysis?
To perform data analysis, follow these steps:
- Collect Data: Gather the data you want to analyze.
- Clean Data: Remove duplicates, correct errors, and handle missing values.
- Explore Data: Use descriptive statistics and visualization to understand the data.
- Analyze Data: Apply statistical or machine learning techniques to draw conclusions or make predictions.
- Interpret Results: Make sense of the analysis outcomes and how they impact your objectives.
What is Data Analysis with example?
How do I run an ANOVA in Excel?
To run an ANOVA (Analysis of Variance) in Excel, you can use the Data Analysis Toolpak add-in:
Hello, I’m Cansu, a professional dedicated to creating Excel tutorials, specifically catering to the needs of B2B professionals. With a passion for data analysis and a deep understanding of Microsoft Excel, I have built a reputation for providing comprehensive and user-friendly tutorials that empower businesses to harness the full potential of this powerful software.
I have always been fascinated by the intricate world of numbers and the ability of Excel to transform raw data into meaningful insights. Throughout my career, I have honed my data manipulation, visualization, and automation skills, enabling me to streamline complex processes and drive efficiency in various industries.
As a B2B specialist, I recognize the unique challenges that professionals face when managing and analyzing large volumes of data. With this understanding, I create tutorials tailored to businesses’ specific needs, offering practical solutions to enhance productivity, improve decision-making, and optimize workflows.
My tutorials cover various topics, including advanced formulas and functions, data modeling, pivot tables, macros, and data visualization techniques. I strive to explain complex concepts in a clear and accessible manner, ensuring that even those with limited Excel experience can grasp the concepts and apply them effectively in their work.
In addition to my tutorial work, I actively engage with the Excel community through workshops, webinars, and online forums. I believe in the power of knowledge sharing and collaborative learning, and I am committed to helping professionals unlock their full potential by mastering Excel.
With a strong track record of success and a growing community of satisfied learners, I continue to expand my repertoire of Excel tutorials, keeping up with the latest advancements and features in the software. I aim to empower businesses with the skills and tools they need to thrive in today’s data-driven world.
Suppose you are a B2B professional looking to enhance your Excel skills or a business seeking to improve data management practices. In that case, I invite you to join me on this journey of exploration and mastery. Let’s unlock the true potential of Excel together!
https://www.linkedin.com/in/cansuaydinim/

