Power View for Excel: Unleashing the Power of Data Visualization
In today’s data-driven world, Excel has become an indispensable tool for businesses, professionals, and students alike. It offers a wide range of functionalities, and one such powerful feature is Power View for Excel. In this article, we will explore the capabilities of Power View for Excel and how it can revolutionize how you analyze and present your data.
Table of Contents
Power View for Excel
Understanding Power View
Power View is a data visualization tool that allows users to create interactive reports, presentations, and dashboards directly within Excel. It enables users to transform raw data into engaging visualizations that facilitate data exploration and storytelling. With Power View, users can easily navigate through data, filter information, and drill down into specific details, providing a comprehensive understanding of the underlying data.
Getting Started with Power View
To access Power View in Excel, you need to have a compatible version, such as Excel 2013 or later, and ensure that the Power View add-in is enabled. Once enabled, you can start creating Power View reports by importing data from various sources or utilizing existing Excel tables. With an intuitive user interface, Power View offers a range of visualization options, including charts, tables, matrices, and maps, allowing users to customize their reports based on specific requirements.
Creating Interactive Dashboards
One of the standout features of Power View is its ability to create interactive dashboards that enable users to visualize multiple datasets and explore them dynamically. By combining different visual elements, such as charts, slicers, and filters, users can create a rich and interactive experience for their audience. With just a few clicks, users can drill down into specific data points, filter results, and gain valuable insights on the fly.
Visualizing Data Trends
Power View excels in visualizing data trends over time. Whether it’s sales figures, stock prices, or website traffic, Power View allows users to create compelling visualizations that highlight patterns and trends. By leveraging the power of animated transitions and interactive elements, users can present data in a visually engaging manner, making it easier for stakeholders to grasp the key takeaways from the data.
Exploring Geographic Data
Geographic data is an essential component of many business analyses. Power View provides built-in mapping capabilities, allowing users to create visually stunning maps that represent data based on geographical regions. Whether it’s sales by region, customer distribution, or market penetration, Power View’s mapping feature brings data to life and enables users to gain geographic insights that were previously difficult to visualize.
Analyzing Sales Performance
For businesses, understanding sales performance is crucial for decision-making and strategy formulation. Power View offers a comprehensive set of visualization tools to analyze sales data effectively. With the ability to create interactive charts, filtered views, and drill-through reports, users can explore sales data from multiple angles, identify trends, and discover potential areas for improvement.
Enhancing Data Exploration
Power View goes beyond traditional static charts and tables by offering a dynamic and exploratory approach to data analysis. Users can quickly change chart types, switch dimensions, and apply filters on the fly, allowing them to gain different perspectives and uncover hidden insights. With Power View, the exploration of data becomes an interactive and engaging experience, leading to more informed decision-making.
The Power of Data Visualization: Power View for Excel
Enhancing Understanding with Visuals
Humans are visual creatures, and our brains are wired to process visual information more efficiently than text or numbers alone. Data visualization leverages this inherent ability, enabling us to grasp complex concepts, identify patterns, and uncover hidden insights. Power View takes data visualization to the next level, empowering users to create compelling visual stories that resonate with their audience.
Uncovering Trends and Patterns
Data holds immense potential but can be overwhelming when presented in its raw form. Power View simplifies the process by allowing users to transform data into visually appealing charts, graphs, maps, and tables. By presenting information visually, Power View enables users to identify trends, patterns, and outliers that might otherwise go unnoticed.
Interactive Exploration
One of the key strengths of Power View is its interactive nature. Users can easily filter, sort, and drill down into their data, gaining deeper insights and exploring different perspectives. With just a few clicks, you can slice and dice your data, dynamically changing the visualization to focus on specific aspects or compare different variables. This interactivity fosters a more engaging and exploratory data analysis experience.
Getting Started with Power View for Excel
Enabling Power View
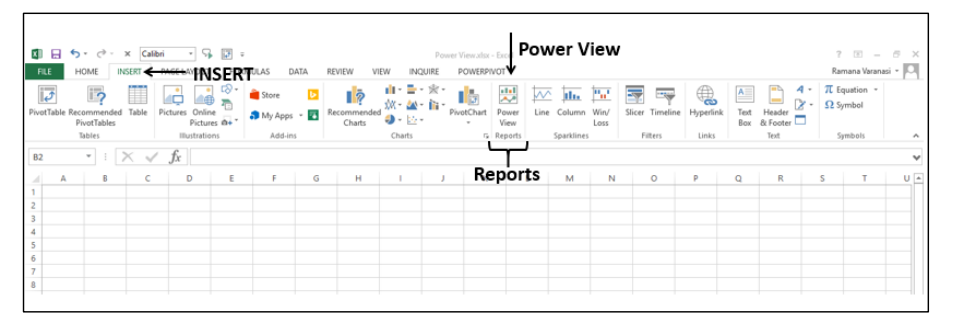
To get started with Power View, you need to ensure that it is enabled in your Excel installation. By default, Power View is available in Excel 2013 and later versions. If you are using an earlier version, you may need to install the necessary add-in. Once enabled, you can find the Power View button in the “Insert” tab of the Excel ribbon.
Importing Data
To create visualizations in Power View, you need to import your data into Excel. You can import data from various sources such as Excel spreadsheets, SQL databases, and online data repositories. Excel provides intuitive data import wizards that guide you through the process, making it easy to connect to your data sources and bring in the required data for analysis.
Designing Visualizations
Once your data is imported, you can start designing visualizations using Power View. With Power View, you have a wide range of visualization options at your disposal, including charts, maps, tables, and matrices. You can choose the appropriate visualization type based on the nature of your data and the insights you want to convey. Power View also allows you to customize the appearance of your visualizations, including colors, fonts, and labels, to create a visually appealing and cohesive story.
Benefits of Microsoft Power View for Excel Download
1. Enhanced Data Analysis
Power View provides a rich set of visualization options that allow users to analyze data from different angles. With features like interactive filters, sorting, and highlighting, users can easily identify patterns, trends, and outliers in their data. This enables them to gain deeper insights and make data-driven decisions with confidence.
2. Engaging Presentations
Presenting data in a visually appealing and interactive manner is key to capturing and retaining the attention of your audience. Power View enables you to create dynamic presentations that encourage exploration and interaction. By incorporating interactive visuals and slicers, you can empower your audience to explore the data themselves and draw their own conclusions.
3. Seamless Integration with Excel
As a part of the Microsoft Excel suite, Power View seamlessly integrates with other Excel features and functionalities. You can leverage the power of Excel formulas, pivot tables, and data connections to create comprehensive and insightful reports. Also, this integration ensures that you can work with your data efficiently and harness the full potential of Excel’s capabilities.
4. Collaboration and Sharing
With Power View, you can easily share your reports and presentations with others. You can save your Power View reports as Excel workbooks or publish them to SharePoint for broader access. Also, this facilitates collaboration within your team and allows stakeholders to interact with the data and provide feedback. Additionally, you can export your Power View visuals as static images or PowerPoint slides for inclusion in other documents or presentations.
Conclusion
Power View for Excel is a game-changer when it comes to data visualization. It empowers users to create visually stunning and interactive reports, dashboards, and presentations, enabling them to communicate insights effectively and make data-driven decisions. By leveraging the power of Power View, you can unlock the hidden potential of your data and gain a competitive edge in today’s data-centric world.
So why wait? Start exploring the world of Power View for Excel today and unleash the power of data visualization!
Project Cubicle Recommends
- If you’re looking to create impressive 3D plots in Excel, check out the article “How to Create a 3D Plot in Excel?” for a step-by-step guide and unleash your data visualization skills.
- Get back to the basics and master essential Excel formulas with the article “6 Classics! Basic Excel Formulas.” Also, discover the fundamental formulas that will empower you to perform calculations and analyses with ease.
Hello, I’m Cansu, a professional dedicated to creating Excel tutorials, specifically catering to the needs of B2B professionals. With a passion for data analysis and a deep understanding of Microsoft Excel, I have built a reputation for providing comprehensive and user-friendly tutorials that empower businesses to harness the full potential of this powerful software.
I have always been fascinated by the intricate world of numbers and the ability of Excel to transform raw data into meaningful insights. Throughout my career, I have honed my data manipulation, visualization, and automation skills, enabling me to streamline complex processes and drive efficiency in various industries.
As a B2B specialist, I recognize the unique challenges that professionals face when managing and analyzing large volumes of data. With this understanding, I create tutorials tailored to businesses’ specific needs, offering practical solutions to enhance productivity, improve decision-making, and optimize workflows.
My tutorials cover various topics, including advanced formulas and functions, data modeling, pivot tables, macros, and data visualization techniques. I strive to explain complex concepts in a clear and accessible manner, ensuring that even those with limited Excel experience can grasp the concepts and apply them effectively in their work.
In addition to my tutorial work, I actively engage with the Excel community through workshops, webinars, and online forums. I believe in the power of knowledge sharing and collaborative learning, and I am committed to helping professionals unlock their full potential by mastering Excel.
With a strong track record of success and a growing community of satisfied learners, I continue to expand my repertoire of Excel tutorials, keeping up with the latest advancements and features in the software. I aim to empower businesses with the skills and tools they need to thrive in today’s data-driven world.
Suppose you are a B2B professional looking to enhance your Excel skills or a business seeking to improve data management practices. In that case, I invite you to join me on this journey of exploration and mastery. Let’s unlock the true potential of Excel together!
https://www.linkedin.com/in/cansuaydinim/


