Excel Rows Vs. Columns: Understanding the Difference and When to Use Each
Rows vs Columns: Introduction
Excel is a powerful tool that has revolutionized how we handle data and perform calculations. Whether you are a student, a professional, or a business owner, chances are you have used Excel at some point in your life. One of the fundamental concepts in Excel is understanding the difference between rows and columns. This article will delve deep into Excel rows and columns, exploring their characteristics, applications, and when it is best to use each one.
Table of Contents
Excel Rows Vs. Columns
Microsoft Excel is a powerful spreadsheet program that is widely used for data analysis, calculation, and organization. When working with Excel, you will frequently come across the terms “rows” and “columns.” Understanding the difference between rows and columns is essential for effective data management and manipulation. In this article, we will explore the concept of rows and columns in Excel and discuss their significance in various scenarios.

Introduction
Excel is a versatile tool that allows users to organize and analyze data efficiently. To make the most of Excel’s capabilities, it is crucial to understand the concepts of rows and columns.
What are Rows and Columns?
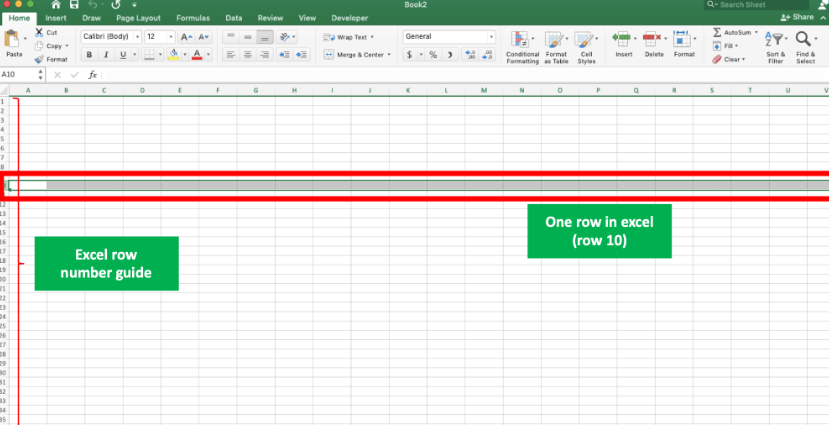
In Excel, a row is a horizontal line of cells running from left to right, while a column is a vertical line of cells running from top to bottom. Rows are identified by numbers (1, 2, 3, etc.), and columns are identified by letters (A, B, C, etc.). Together, rows and columns create a grid-like structure called a worksheet.
The Structure of Excel Worksheets
Excel worksheets are composed of cells organized in a grid-like pattern. Each cell is identified by a unique combination of a column letter and a row number, such as A1, B3, or F10. The intersection of a row and a column forms a cell, which is the smallest unit of data in Excel.
Rows: Horizontal Organization of Data
Rows in Excel are used to horizontally organize and store data. Typically, rows are used to represent individual records or observations. For example, in a sales spreadsheet, each row might represent a different customer, and the columns would contain information like name, email, and purchase history.
4.1 Inserting and Deleting Rows
To insert a new row in Excel, right-click on the row number where you want to insert the row, and select “Insert.” Similarly, to delete a row, right-click on the row number and choose “Delete.” These operations allow you to adjust the structure of your data dynamically.
4.2 Formatting Rows
Excel provides various formatting options for rows, such as changing the font, applying cell shading, or adding borders. Formatting rows can help improve the visual appearance of your data and make it easier to read and understand.
4.3 Adjusting Row Height
Sometimes, the default row height in Excel may not be sufficient to display the content of a cell fully. You can adjust the row height by dragging the boundary between two rows or by using the “Row Height” option in the “Format” menu. This ensures that all the data in a cell is visible.
Columns: Vertical Organization of Data
Columns in Excel are used to vertically organize and store data. They are commonly used to represent different attributes or variables associated with each row. For instance, in a financial spreadsheet, each column might represent a different month, and the rows would contain data such as income, expenses, and profits.
5.1 Inserting and Deleting Columns
To insert a new column in Excel, right-click on the column letter where you want to insert the column, and select “Insert.” Similarly, to delete a column, right-click on the column letter and choose “Delete.” These operations allow you to adjust the structure of your data dynamically.
5.2 Formatting Columns
Excel provides a range of formatting options for columns, such as changing the column width, aligning text, or applying number formats. Formatting columns can help you present your data in a visually appealing and organized manner.
5.3 Adjusting Column Width
Similar to adjusting row height, you can adjust the width of a column by dragging the boundary between two columns or by using the “Column Width” option in the “Format” menu. This ensures that the data in each cell is fully visible and properly aligned.
The Relationship between Rows and Columns
Rows and columns work together to create a grid-like structure that allows you to manage and analyze data effectively. Each cell within the grid represents a unique intersection of a row and a column, making it easy to locate and reference specific data points.
Rows vs Columns: Practical Applications
Understanding how to work with rows and columns in Excel is essential for a wide range of tasks. Here are some practical applications where rows and columns play a vital role:
7.1 Data Entry and Organization
Rows and columns provide a systematic way to enter and organize data in Excel. By placing different data points in separate cells within rows and columns, you can easily sort, filter, and analyze the information.
7.2 Data Analysis and Manipulation
Excel offers powerful tools for analyzing and manipulating data. By performing operations on specific rows or columns, you can calculate totals, averages, perform mathematical operations, and apply formulas to derive valuable insights from your data.
7.3 Creating Charts and Graphs
Rows and columns serve as the foundation for creating charts and graphs in Excel. By selecting specific ranges of data organized in rows and columns, you can visualize your information using various chart types, such as bar graphs, pie charts, or line graphs.
Best Practices for Working with Rows and Columns
To optimize your Excel workflow, consider the following best practices when working with rows and columns:
8.1 Naming Rows and Columns
Assign meaningful names to rows and columns whenever possible. This makes it easier to navigate through large datasets and provides context for the data contained within.
8.2 Freezing Rows and Columns
Freezing rows or columns allows you to keep certain rows or columns visible while scrolling through a large dataset. This feature is helpful when working with long spreadsheets where you want to keep specific information in view.
8.3 Hiding Rows and Columns
If you have data that is not relevant to your immediate analysis or presentation, you can hide rows or columns to declutter your worksheet. This helps focus attention on the relevant data and improves readability.
Rows vs Columns: Conclusion
Rows and columns are fundamental components of Excel that enable efficient data organization, analysis, and manipulation. Understanding how to utilize and manage rows and columns effectively will enhance your productivity and proficiency in Excel.
FAQs
10.1 What is the maximum number of rows and columns in Excel?
In Excel, the maximum number of rows is 1,048,576, and the maximum number of columns is 16,384 in the most recent versions (Excel 2019 and Excel 365).
10.2 How can I select an entire row or column in Excel?
To select an entire row, click on the row number. To select an entire column, click on the column letter. Alternatively, you can use the keyboard shortcuts Shift + Spacebar to select a row and Ctrl + Spacebar to select a column.
10.3 Can I convert rows to columns or vice versa in Excel?
Yes, you can convert rows to columns or vice versa using the “Transpose” feature in Excel. This feature allows you to switch the orientation of your data easily.
10.4 How do I autofit rows or columns in Excel?
To autofit a row or column to its contents, double-click on the boundary between the row or column headers. Excel will adjust the height or width automatically to fit the content.
10.5 Is it possible to sort data based on a specific column in Excel?
Yes, you can sort data in Excel based on a specific column. Select the range of data you want to sort, click on the “Sort” button in the “Data” tab, and choose the column you want to sort by.
Hello, I’m Cansu, a professional dedicated to creating Excel tutorials, specifically catering to the needs of B2B professionals. With a passion for data analysis and a deep understanding of Microsoft Excel, I have built a reputation for providing comprehensive and user-friendly tutorials that empower businesses to harness the full potential of this powerful software.
I have always been fascinated by the intricate world of numbers and the ability of Excel to transform raw data into meaningful insights. Throughout my career, I have honed my data manipulation, visualization, and automation skills, enabling me to streamline complex processes and drive efficiency in various industries.
As a B2B specialist, I recognize the unique challenges that professionals face when managing and analyzing large volumes of data. With this understanding, I create tutorials tailored to businesses’ specific needs, offering practical solutions to enhance productivity, improve decision-making, and optimize workflows.
My tutorials cover various topics, including advanced formulas and functions, data modeling, pivot tables, macros, and data visualization techniques. I strive to explain complex concepts in a clear and accessible manner, ensuring that even those with limited Excel experience can grasp the concepts and apply them effectively in their work.
In addition to my tutorial work, I actively engage with the Excel community through workshops, webinars, and online forums. I believe in the power of knowledge sharing and collaborative learning, and I am committed to helping professionals unlock their full potential by mastering Excel.
With a strong track record of success and a growing community of satisfied learners, I continue to expand my repertoire of Excel tutorials, keeping up with the latest advancements and features in the software. I aim to empower businesses with the skills and tools they need to thrive in today’s data-driven world.
Suppose you are a B2B professional looking to enhance your Excel skills or a business seeking to improve data management practices. In that case, I invite you to join me on this journey of exploration and mastery. Let’s unlock the true potential of Excel together!
https://www.linkedin.com/in/cansuaydinim/


