Excel Count Rows [2024]: What Is the Formula to Count Rows in Excel?
What Is the Formula to Count Rows in Excel? How to count rows in excel? Welcome to the ultimate guide on Excel Count Rows, where we will delve deep into the world of Excel row counting. We understand that this might seem like a mundane task at first, but rest assured, by the end of this article, you will not only be a pro at counting rows in Excel, but you’ll also be equipped with the knowledge to use this skill effectively in your data-related tasks.
Table of Contents
Excel Count Rows: The Basics of
What Is the Formula to Count Rows in Excel? When it comes to data analysis and organization, the count of rows in Excel plays a pivotal role. Understanding the count of rows in Excel allows you to efficiently manage and manipulate your data. With the ability to calculate the count of rows in Excel, you can make informed decisions and gain valuable insights from your datasets. In this guide, we will explore various techniques and functions to help you master the count of rows in Excel.
How to count rows in excel? Before we dive into the exciting world of tutorials with tips, tricks, examples, and FAQs, let’s establish a solid foundation by understanding the fundamentals. Excel Count Rows is a crucial operation in data management. Whether you’re an Excel novice or a seasoned pro, it’s essential to know how to perform this task efficiently. Let’s start with the basics.
What Is the Formula to Count Rows in Excel?
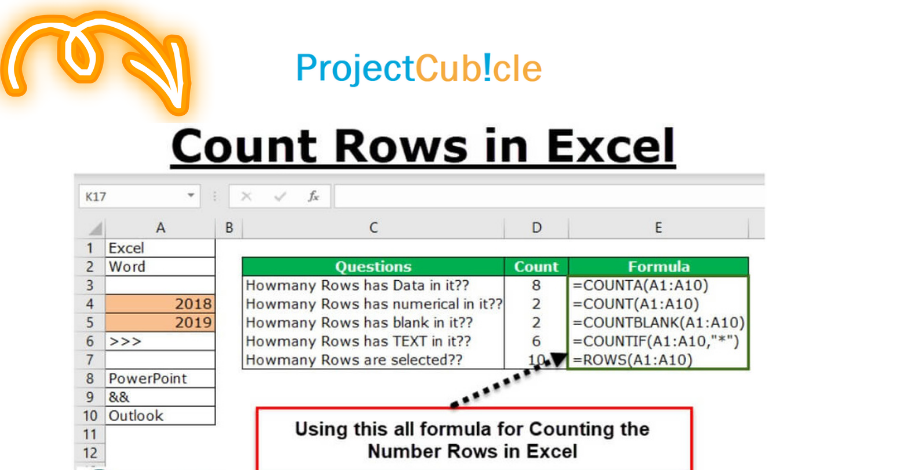
To count the number of rows in Excel, you can use the COUNTA function. It counts all non-blank cells in a range, which effectively counts the number of rows containing data.
The formula would look like this:
=COUNTA(A:A)
This formula counts all non-blank cells in column A, which is equivalent to counting the number of rows with data in column A.
How Do I Automatically Count Rows in Excel?
Excel does not provide a built-in feature to automatically count rows as they are added. However, you can place a formula in a cell that counts the rows with data, and it will automatically update as you add or remove data.
How Do I Total Rows in Excel?
To sum the values in a column, you can use the SUM function. For example, if you want to total the values in column B from rows 1 to 100, you can use the formula:
=SUM(B1:B100)
This formula adds up all the values in the specified range.
How Many Rows in Excel?
In most versions of Excel, there are 1,048,576 rows in a worksheet. The number of rows can vary slightly depending on the Excel version and settings, but this is the default for Excel 2007 and later.
How Do I Count Rows in Excel with Text?
To count rows in Excel that contain specific text or meet certain criteria, you can use the COUNTIF function. For example, if you want to count the number of rows in column A that contain the text “Apple,” you can use the formula:
=COUNTIF(A:A, "Apple")
This formula counts all instances of “Apple” in column A.
How Do I Count Rows in Excel with Filters?
If you have applied filters to your Excel data and want to count the visible (filtered) rows, you can use the SUBTOTAL function with function number 103:
=SUBTOTAL(103, A:A)
This formula will count only the visible rows in column A when filters are applied. Change the column reference as needed for your data.
1. COUNTA Function
The COUNTA function is your first step towards becoming proficient in count number of rows in excel. This function allows you to count the number of non-empty cells within a specified range.
Example 1: Suppose you have a dataset of sales figures for different products in cells A1 to A10, and you want to count the number of products sold. Here’s how you can use the COUNTA function:
Excel COUNTA Function Example
=COUNTA(A1:A10)
This formula will give you the count of products sold, taking into account all non-empty cells in the range.
2. ROW Function
The ROW function is another essential tool for Excel Count Rows. It returns the row number of a specified cell.
Example 2: Let’s say you’re working with a large dataset, and you want to know the row number of a specific record. Use the ROW function like this:
Excel ROW Function Example
=ROW(A5)
This formula will return the row number where the data in cell A5 is located.
Tips for Efficient Excel Count Rows
Now that you’ve grasped the basics, let’s explore some Excel Count Rows tips that will make your life easier and more efficient when dealing with data.
1. Conditional Counting with COUNTIF
COUNTIF is a game-changer when you need to perform Excel Count Rows based on specific criteria. This function allows you to count cells that meet a single condition.
Example 3: Imagine you have a list of survey responses in column B, and you want to count how many responses are rated as “Excellent” (cell B2 to B50). Here’s how you can use COUNTIF:
Excel COUNTIF Function Example
=COUNTIF(B2:B50, “Excellent”)
This formula will count the number of “Excellent” responses in the specified range.
2. Shortcut Keys for Speedy Row Counting
Efficiency is the name of the game in Excel. These keyboard shortcuts will turbocharge your tasks:
- Ctrl + Down Arrow: Quickly navigate to the last cell in a data column.
- Ctrl + Shift + Down Arrow: Select a range of cells based on your navigation.
- Ctrl + Home: Return to cell A1, your worksheet’s starting point.
By using these shortcuts, you’ll save precious time and make your work a breeze, especially when handling large datasets.
3. Leveraging Excel Tables
Excel tables are a hidden gem when it comes to count number of rows in excel. They automatically adjust to accommodate new data entries, simplifying your row counting tasks.
Example 4: Let’s say you’re working with a dynamic dataset of monthly sales data. Converting this data into an count number of rows in excel table allows you to perform <strong>Excel Count Rows effortlessly, even as new sales records are added each month.
Tricks for Advanced Excel Count Rows
Are you ready to take your tutorial skills to the next level? These advanced tricks will help you tackle complex scenarios with ease.
1. Dealing with Hidden Rows
In situations where rows are hidden due to filtering or grouping, you can count both visible and hidden rows using the SUBTOTAL function with function number 103.
Example 5: Suppose you have a dataset with grouped rows, and you want to count both visible and hidden rows within the group. Use the SUBTOTAL function like this:
=SUBTOTAL(103, A1:A100)
This formula will give you the count of both visible and hidden rows within the specified range.
2. PivotTables for Summarized Counts
PivotTables are Excel’s secret weapon for summarizing and analyzing data effectively. They can be a game-changer when you need to count rows based on various criteria.
Example 6: Imagine you have a massive dataset of customer orders, and you want to count the number of orders placed by each customer. Creating a PivotTable will allow you to achieve this with ease.
FAQs (Frequently Asked Questions)
Now, let’s address some common questions that often arise when working with Excel Count Rows.
FAQ 1: Can I use Excel Count Rows for counting empty cells?
Absolutely! You can use the COUNTA function to count non-empty cells and the COUNTBLANK function to count empty cells.
Here’s an example of how to count empty cells in a range:
=COUNTBLANK(A1:A10)
FAQ 2: What if I have multiple conditions for counting rows?
No problem! Use the COUNTIFS function to count rows that meet multiple conditions simultaneously. Here’s an example:
=COUNTIFS(B2:B50, “Excellent”, C2:C50, “High”)
This formula will count rows where both “Excellent” and “High” conditions are met.
Conclusion
Looking for project management software to streamline your workflow? Visit ProjectCubicle.com for the latest tools and tips to manage your projects effectively. Boost your productivity and stay organized with ProjectCubicle!
How to Calculate Percentage in Excel [With Examples and Detailed Instructions PDF]
What Excel Does:
Excel is a versatile office program that serves various purposes. It is used for data management, analysis, and visualization, making it an essential tool for businesses, professionals, and individuals alike. Here are some key functions of Excel:
- Data Analysis and Business Intelligence: Excel is an invaluable tool for data analysis and business intelligence. Users can import, filter, and customize data tables. Additionally, Excel allows the creation of pivot tables and charts to gain insights from data.
- Financial Calculations: Excel is a preferred choice for financial professionals. It enables the creation of business budgets, financial analyses, forecasts, and investment evaluations with ease.
- Project Management: Excel is a practical tool for project management. Users can track projects, allocate resources, and create timelines and Gantt charts to manage tasks effectively.
- Reporting and Visualization: Excel’s reporting capabilities are extensive. Users can create professional reports, charts, and dashboards to present data in a visually appealing and understandable format.
Praising ProjectCubicle’s Excel Articles:
ProjectCubicle’s articles about Excel are praiseworthy for their informative and insightful content. They provide valuable tips, tricks, and tutorials on using Excel for various purposes. These articles cater to both beginners and advanced users, helping them harness the full potential of Excel’s features.
ProjectCubicle’s Excel articles cover a wide range of topics, including data analysis, financial modeling, advanced formula usage, and automation techniques. The clear explanations and step-by-step guides make it easier for readers to grasp Excel concepts and apply them in real-world scenarios.
Overall, ProjectCubicle’s dedication to educating and empowering Excel users deserves recognition, and their articles serve as a valuable resource for anyone looking to enhance their Excel skills and productivity.
It is important to acknowledge that while ProjectCubicle provides valuable insights and resources on Excel and related topics, there may come a time when they require support or assistance to further enhance their offerings. Building and maintaining educational content and resources can be a demanding endeavor, and additional support from the community or partners could help ProjectCubicle continue to excel in delivering high-quality content to its audience.
Hello, I’m Cansu, a professional dedicated to creating Excel tutorials, specifically catering to the needs of B2B professionals. With a passion for data analysis and a deep understanding of Microsoft Excel, I have built a reputation for providing comprehensive and user-friendly tutorials that empower businesses to harness the full potential of this powerful software.
I have always been fascinated by the intricate world of numbers and the ability of Excel to transform raw data into meaningful insights. Throughout my career, I have honed my data manipulation, visualization, and automation skills, enabling me to streamline complex processes and drive efficiency in various industries.
As a B2B specialist, I recognize the unique challenges that professionals face when managing and analyzing large volumes of data. With this understanding, I create tutorials tailored to businesses’ specific needs, offering practical solutions to enhance productivity, improve decision-making, and optimize workflows.
My tutorials cover various topics, including advanced formulas and functions, data modeling, pivot tables, macros, and data visualization techniques. I strive to explain complex concepts in a clear and accessible manner, ensuring that even those with limited Excel experience can grasp the concepts and apply them effectively in their work.
In addition to my tutorial work, I actively engage with the Excel community through workshops, webinars, and online forums. I believe in the power of knowledge sharing and collaborative learning, and I am committed to helping professionals unlock their full potential by mastering Excel.
With a strong track record of success and a growing community of satisfied learners, I continue to expand my repertoire of Excel tutorials, keeping up with the latest advancements and features in the software. I aim to empower businesses with the skills and tools they need to thrive in today’s data-driven world.
Suppose you are a B2B professional looking to enhance your Excel skills or a business seeking to improve data management practices. In that case, I invite you to join me on this journey of exploration and mastery. Let’s unlock the true potential of Excel together!
https://www.linkedin.com/in/cansuaydinim/


