Mathematical Functions in Excel: 5 Most Frequently used Mathematical Functions in Excel
In the realm of data analysis and management, Mathematical Functions in Excel /mathematical and statistical functions in excel (mathematical functions in excel with examples) stand as towering giants, simplifying complex calculations and transforming raw data into insightful information. Whether you’re a financial analyst, an educator, or just a curious learner, understanding these functions can dramatically enhance your spreadsheet skills. This article delves deep into the world of Excel’s mathematical and statistical functions in excel, offering examples, tips, and tricks to make your data work for you.
Table of Contents
Mathematical Functions in Excel
Understanding the Basics
At its core, Excel offers a plethora of mathematical functions (mathematical functions in excel with examples) designed to tackle various numerical operations, from basic arithmetic to complex trigonometric calculations. These functions form the backbone of data analysis in Excel, allowing users to perform calculations efficiently and accurately.
SUM Function: Adding It All Up
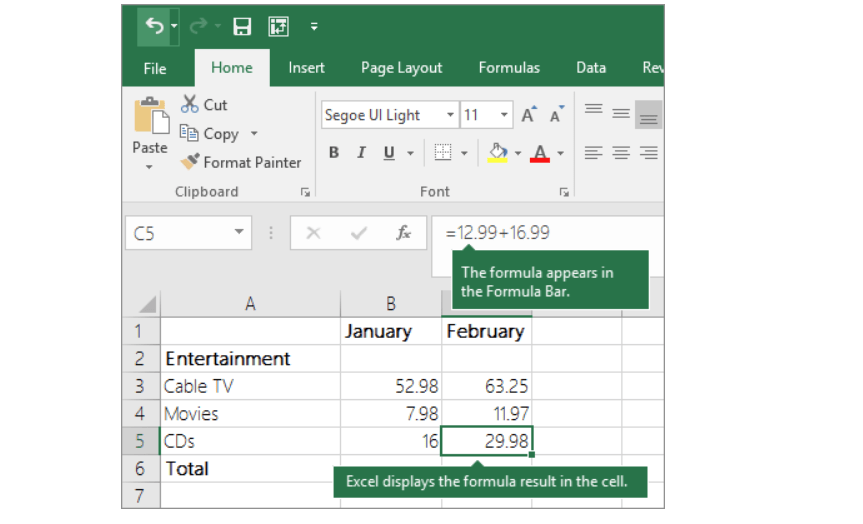
One of the most fundamental yet powerful mathematical and statistical functions in excel, the SUM function allows you to quickly add up a range of numbers with minimal fuss. For instance, =SUM(A1:A10) effortlessly totals the numbers from cells A1 through A10.
AVERAGE Function: Finding the Middle Ground
The AVERAGE function calculates the mean of the numbers you specify. It’s as simple as =AVERAGE(B1:B5), providing the average value of the cells B1 through B5.
MAX and MIN Functions: Identifying Extremes
To pinpoint the highest and lowest numbers in a dataset, the MAX and MIN functions are your go-to tools. Use =MAX(C1:C10) to find the maximum value and =MIN(C1:C10) for the minimum value within a specified range.
POWER and SQRT Functions: Exponential Insights and Square Roots
Diving into more specialized operations, the POWER function, =POWER(number, power), raises a number to a certain power, while the SQRT function, =SQRT(number), calculates the square root of a given number, unlocking a new dimension of data analysis.

Mathematical Functions in Excel
ROUND, ROUNDUP, and ROUNDDOWN: Precision Control
These mathematical and statistical functions in excel, are essential for managing the precision of your calculations. =ROUND(number, num_digits) rounds a number to a specified number of digits, whereas =ROUNDUP(number, num_digits) and =ROUNDDOWN(number, num_digits) offer more control by rounding numbers up or down, respectively.
ABS Function: Absolute Value Calculations
The ABS function returns the absolute value of a number, eliminating any sign. This is particularly useful in scenarios where you’re only interested in the magnitude of changes or differences, illustrated by =ABS(-20) returning 20.
Data Lineage in Manufacturing and How It Is Used- projectcubicle
Trigonometric Functions: SIN, COS, and TAN
Excel is not just about basic arithmetic; it also supports advanced mathematical operations like trigonometry. Functions such as SIN, COS, and TAN allow you to perform sine, cosine, and tangent calculations on angles provided in radians, essential for various engineering and scientific applications.
Combining Functions for Advanced Calculations
The real power of Mathematical Functions in Excel shines when you start combining them. For example, you could calculate the mean absolute deviation of a dataset by combining the AVERAGE and ABS functions in a creative formula.
5 Most Frequently Used Mathematical Functions in Excel (mathematical functions in excel with examples)
- SUM: The Quintessential AggregatorThe SUM function is arguably the most used Excel function, allowing users to quickly total a column, row, or range of numbers. Its simplicity,
=SUM(A1:A10), belies its powerful impact on speeding up calculations. - AVERAGE: Balancing the ScalesWhen it comes to finding the mean value of a dataset, the AVERAGE function stands out. It calculates the average of the numbers provided, making it indispensable for performance analysis, financial reporting, and more.
- MIN and MAX: Identifying BoundariesThe MIN and MAX functions help users easily identify the smallest and largest values in a dataset, respectively. These functions are crucial for range analysis, peak performance assessments, and identifying outliers.
- COUNT and COUNTA: Number CrunchingCOUNT is used to count the number of cells that contain numbers, while COUNTA counts the number of non-empty cells. These functions are vital for data validation, inventory management, and tracking participation or responses in surveys.
- IF: Logical Operations SimplifiedThe IF function performs a logical test and returns one value for a TRUE result, and another for a FALSE result. This function is incredibly versatile, used in scenarios ranging from financial modeling to task automation.
SUM: Beyond Basic Addition
- Scenario: Calculating Monthly Expenses
- Example:
=SUM(D2:D31)could represent adding up daily expenses listed from D2 to D31 for a monthly total.
- Example:
- Advanced Use: Summing Alternate Rows for Subtotals
- Example:
=SUMPRODUCT(--(MOD(ROW(A1:A10)-ROW(A1),2)=0),A1:A10)sums every other row in a range from A1 to A10, useful for subtotals in lists where every other row represents a category.
- Example:
Excel Group Sum Function: Simplify Your Data Analysis – projectcubicle
AVERAGE: Finding Mean in Various Contexts
- Scenario: Average Sales Calculation
- Example:
=AVERAGE(F2:F10)calculates the average sales figures listed from F2 to F10.
- Example:
- Advanced Use: Averaging Non-Contiguous Ranges
- Example:
=AVERAGE(B2:B5,D2:D5,F2:F5)averages cells in separate ranges, useful for comparing different datasets or time periods.
- Example:
MIN and MAX: Extremes in Data
- Scenario: Tracking Stock Prices
- Example for MIN:
=MIN(B2:B365)finds the lowest stock price in a year. - Example for MAX:
=MAX(B2:B365)identifies the highest price in the same period.
- Example for MIN:
- Advanced Use: Dynamic Range Selection
- Example:
=MIN(OFFSET(A1,0,0,COUNT(A:A),1))dynamically calculates the minimum value as data is added to column A.
- Example:
COUNT and COUNTA: Tallying Entries
- Scenario: Attendance Records
- Example for COUNT:
=COUNT(B2:B31)counts the number of days attended marked with numbers. - Example for COUNTA:
=COUNTA(C2:C31)tallies the days with any entries, including text for partial attendance.
- Example for COUNT:
- Advanced Use: Counting Specific Entries
- Example:
=COUNTIF(A1:A10, ">5")counts the number of cells with values greater than 5 in a range from A1 to A10.
- Example:
IF: Decision-Based Calculations
- Scenario: Bonus Eligibility
- Example:
=IF(B2>10000, "Eligible", "Not Eligible")checks if the sales figure in B2 exceeds $10,000 to determine bonus eligibility.
- Example:
- Advanced Use: Nested IF for Multiple Conditions
- Example:
=IF(B2>=10000, "High", IF(B2>=5000, "Medium", "Low"))categorizes sales figures into high, medium, or low based on thresholds.
- Example:
FAQs
How can I use the IF function with mathematical functions?
The IF function can be used to perform conditional calculations. For instance, =IF(A1>100, SUM(A1:A5), AVERAGE(A1:A5)) decides between summing or averaging values based on a condition.
Can mathematical functions be used across multiple sheets?
Yes, mathematical functions can reference data across multiple sheets. For example, =SUM(Sheet2!A1:A10) adds up values from another sheet.
What’s the best way to learn advanced mathematical functions in Excel?
Practice is key. Experiment with different functions, combine them, and try solving real-world problems to deepen your understanding.
Are there any limitations to Excel’s mathematical functions?
While Excel is powerful, it’s not a substitute for specialized mathematical software for extremely advanced or niche calculations.
Can Excel handle matrix operations?
Excel supports basic matrix operations like multiplication and inversion through functions like MMULT and MINVERSE, opening the door to more complex data analysis.
Conclusion
Mathematical Functions in Excel (mathematical functions in excel with examples) are indispensable tools for anyone looking to perform accurate and efficient data analysis. From basic arithmetic to complex trigonometric calculations, Excel offers a wide range of functions to meet your needs. By mastering these functions, you can unlock the full potential of Excel, turning it into a powerful ally in your data analysis endeavors. Remember, the key to proficiency lies in practice and exploration, so dive in and start experimenting with these functions today.

motivations
Hello, I’m Cansu, a professional dedicated to creating Excel tutorials, specifically catering to the needs of B2B professionals. With a passion for data analysis and a deep understanding of Microsoft Excel, I have built a reputation for providing comprehensive and user-friendly tutorials that empower businesses to harness the full potential of this powerful software.
I have always been fascinated by the intricate world of numbers and the ability of Excel to transform raw data into meaningful insights. Throughout my career, I have honed my data manipulation, visualization, and automation skills, enabling me to streamline complex processes and drive efficiency in various industries.
As a B2B specialist, I recognize the unique challenges that professionals face when managing and analyzing large volumes of data. With this understanding, I create tutorials tailored to businesses’ specific needs, offering practical solutions to enhance productivity, improve decision-making, and optimize workflows.
My tutorials cover various topics, including advanced formulas and functions, data modeling, pivot tables, macros, and data visualization techniques. I strive to explain complex concepts in a clear and accessible manner, ensuring that even those with limited Excel experience can grasp the concepts and apply them effectively in their work.
In addition to my tutorial work, I actively engage with the Excel community through workshops, webinars, and online forums. I believe in the power of knowledge sharing and collaborative learning, and I am committed to helping professionals unlock their full potential by mastering Excel.
With a strong track record of success and a growing community of satisfied learners, I continue to expand my repertoire of Excel tutorials, keeping up with the latest advancements and features in the software. I aim to empower businesses with the skills and tools they need to thrive in today’s data-driven world.
Suppose you are a B2B professional looking to enhance your Excel skills or a business seeking to improve data management practices. In that case, I invite you to join me on this journey of exploration and mastery. Let’s unlock the true potential of Excel together!
https://www.linkedin.com/in/cansuaydinim/


