

Project schedule is not just a Gantt Chart or a timetable that shows what activities are planned to be performed and when. A good schedule is a project schedule model that can answer any “what if” question such as what if an activity is delayed, resource availability changes, material delivery is late, a risk event happens, etc. So, project schedule analysis model is the main decision-making tool. And it shows the possible results of any management decision and provides project management with reliable forecasts for most of the project results.
Table of Contents
Project schedule analysis is for:
- Identifying problems with the schedule network quality such as activities without successors or predecessors, activities whose lags are too long, etc.
- Finding the best ways to crash project schedule, shortening total project duration.
- Finding the ways to save money by adjusting activity durations and optimizing resource requirements.
There are different project schedule analysis quality checks. And these belong to different Agencies for their projects. Some of these checks can apply to any schedule. But, others are project need- and type-specific.
So, let’s discuss the requirements for a project schedule model for any industry and in any project, and schedule optimization techniques.
1. Model Quality Requirements for Project Schedule Analysis
1.1. Scope
Project schedule model should cover everything needed to achieve project goals.
1.2. Activities
In the in-depth schedules project activities should meet the following requirements.
- An activity must have a certain resource crew. If some part of an activity requires other resources than another part, then this activity should have two or more activities.
- Then, activity work volume unit must be the same for every part of an activity.
- Also, expected resource productivity must be the same throughout an activity execution.
- Unit cost and material requirements must be the same for any part of an activity.
- An activity must belong to only one work package.
- And, activity duration must not exceed two reporting periods (preferably one) or its volume of work must be easily measurable in physical units (meters, tons, etc.) for reliable reporting and forecasting of remaining duration. Exception: Hammock activities that last from one event to another in a project schedule.
1.3. Logic of Project Schedule Analysis
Firstly, project schedule model must include Start and Finish milestones.
Then, each activity except these milestones and hammock activities must have a predecessor to its start and a successor from its finish.
Starts and finishes of hammock activities depen on other activities or external events.
If an activity does not have a predecessor to its start, it means that its execution can start before the project start. Hence, an activity that does not have a successor from its finish can complete itself after the project finish. Both situations indicate that something is wrong with the project logic.
1.4. Leads and Lags
Leads and Lags used in the project dependencies must be defined by technological restrictions and justified.
Volume lags (such as a required distance between working crews) are preferable. Time lags demand special attention because the lag time can pass but the expected volume of work is not completed.
1.5. Constraints
Project schedule model can include No Earlier Than constraints. These constraints must be preferably applied to the schedule milestones that reflect some external events (such as weather constraints, the dates when construction site is available, etc.) in a project schedule analysis.
Hard constraints such as Start On, Finish On, or Finish No Later Than should be avoided because they can contradict the schedule logic. It is only permitted when the scheduling tool permits ignoring these constraints when they are unachievable.
1.6. Resource Assignments
Resources must be assigned to all activities whose durations depend on assigned resource quantities and capabilities.
2. Project Schedule Analysis Parameters
2.1. Total Float
PMBOK Guide defines total float as the amount of time that a schedule activity can be delayed or extended from its early start date. Without delaying the project finish date or violating a schedule constraint.
This definition is not clear. First, possible delays of activity start and possible extensions of its duration can be different. With outbound dependencies on both activity start and activity finish, possible delays of activity start and activity finish can differ in their duration (see activity flex below).
Second, this definition does not specify what calendar is necessary when measuring total float. Usually, it is the activity work time.
If the project schedule analysis uses the Critical Path Method that ignores resource constraints, activity total float is an activity property.
Resource constrained schedules can be calculated in different ways. And each project management software uses its own proprietary algorithms. The same activity can have different total floats in different resource constrained schedules for the same project. Therefore, this type of total float is an activity property in the current schedule.
With hard constraints (Start On, Finish On, or No Later Than), total float can become negative. This is one of the reasons why hard constraints must be avoided if your software does not prioritize schedule logic over schedule constraints.
2.2. Free Float in Project Schedule Analysis
PMBOK Guide defines free float as the amount of time that a schedule activity can be delayed without delaying the early start date of any successor or violating a schedule constraint.
Free Float cannot exceed Total Float for the same activity and, like total float, can depend on the schedule if resource constraints have been considered. In the schedules calculated by CPM ignoring resource constraints both total and free floats are activity properties.
2.3. Critical Path
Explore critical path analysis in this informative video if you’re seeking a deeper understanding!
PMBOK Guide defines Critical Path as the “sequence of activities that represents the longest path through a project, which determines the shortest possible duration.”
Once again, this definition creates questions. Project duration can depend on its last activity with Start or Finish No Earlier Than constraint only. This path is certainly not the longest.
When a schedule does not contain time constraints, Critical Path consists of activities with total floats that are less than a certain time value. This value is zero if project activities and resources have the same calendars.
Critical Path determines the shortest project duration in the current schedule. But this schedule may be improved and shortened. We will discuss this further in this paper in project schedule analysis.
When project resources are constrained, Resource Constrained Critical Path (or Resource Critical Path) can include activities that are not linked to each other.
Resource Constrained Critical Path is the sequence of project activities that determines project duration. As in the schedules that do not have resource constraints, resource critical activities have resource constrained total floats that are less than a certain time value, usually zero if the same calendar is used by all activities and resources.
Unfortunately, most popular project scheduling tools calculate wrong total and free floats in resource constrained schedules and do not show correctly which activities are critical in the schedules with resource constraints.
2.4. Drag
Activity drag is the amount of time that an activity on the critical path is adding to the project duration. Alternatively, it is the maximum amount of time that one can shorten the activity duration before it is no longer on the critical path or before its duration becomes zero
Activity drag is a metric belongs to Stephen Devaux.
2.5. Flex
Firstly, Flex is the metric of activity duration flexibility and belongs to Rafael Davila.
Activity Start Flex shows time difference between the earliest possible activity start and future activity start in the current schedule without violating any constraint and activity finish delay.
Activity Finish Flex shows time difference between the latest activity finish and possible activity finish in the current schedule without violating any constraint and activity start delay.
Both metrics mean increasing activity duration by keeping activity start or finish intact.
2.6. Resource Dependencies
In resource constrained schedules activities are delayed if required resources are busy on other activities. The scheduling software must inform about the reasons for activity delays are due to activity logical dependencies. These reasons can include resource, material supply, space, or financial restrictions that.
Activities are usually become late because necessary resources are for other activities in project schedule analysis. We may refer to this as resource dependencies. For example, dummy dependencies that link activities using the resource with those activities that are not on time waiting for these resources. These dependencies must be redefined with each resource constrained scheduling, being the results of current resource constrained schedule analysis.
3. Project Schedule Analysis Optimization and Management
Project schedule created using Critical Path Method or resource leveling heuristic can be compressed if activity durations or dependencies may be revised.
3.1 Fast Tracking
The PMBOK Guide defines fast-tracking as a schedule compression technique in which activities or phases normally performed in a sequence are done in parallel for at least a portion of their duration.
Using this technique, the scheduler analyzes whether critical activities may start earlier than in initial schedule, by replacing Finish-to-Start dependencies with Start-to-Start dependencies with lags. Or, by minimizing lags in Start-to-Start or Finish-to-Finish dependencies.
So, activity Drag shows the maximal shortening of project duration by starting an activity earlier than in the initial schedule.
This technique increases the risk of reworks. Because the succeeding activities start before the works on preceding activities finish.
3.2. Crashing
Crashing is a technique used to shorten the schedule duration for the lowest incremental cost by adding resources.
Using this technique, the scheduler identifies critical activities that can be completed earlier if additional resources were assigned. It means additional expenses and requires selecting those activities that provide the highest compression with the least cost.
Activity Drag shows the maximum reasonable compression of activity duration.
3.3. Schedule Adjustment
But in some schedules, overall project duration can be shortened by increasing the duration of some activities. Although it does not seem obvious and so we will discuss this method, using a sample project.
The Project “Adjustment” consists of four activities and a Finish milestone (Exhibit 1).

Exhibit 1. Gantt Chart for project “Adjustment”
One unit of resource A is on all activities of this project except Activity 2. Because it requires two units of resource A in 3 days. Resources are full time.
Next, dependencies between activities of this project are shown in Exhibit 2.
They include two Start-to-Start dependencies with lags of 2 and 1 days and one Finish-to-Finish dependency.
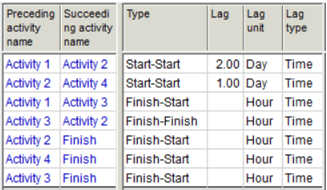
Exhibit 2. Activity Dependencies
Thus, all activities of this project are critical with zero total and free floats.
Activity 2 has positive start and finish Flexes, which means that it may be earlier and/or later without any impact on the dates of other project activities.
Then, activity Drags are positive for all activities except activity 2, whose drag is negative. Negative drag means that, minimizing this activity duration, we will increase the project duration.
Critical Path Method for Project Schedule Analysis
The duration of the project schedule uses Critical Path Method is 15 workdays. And it requires four units of resource A, as in Exhibit 1. If only three units of resource A are available, resource leveling will make project duration two days longer, as in Exhibit 3.

Exhibit 3. Leveled schedule of project “Adjustment”
But what we increase activity 2 duration with the corresponding adjustment of resource workload? Exhibit four shows the resulting schedule if activity 2 duration is 8 days, using the existing start and finish flexes.

Exhibit 4. Adjusted schedule
Also, the project still requires four resource units but two resource units for activity 2 have only 37.5% workload. And these are only busy for 3 hours on each of their 8-hour workdays. If two resource units interchange with just one with the double workload (6 hours per day), we can get the schedule in Exhibit 5.

Exhibit 5. Resource adjusted schedule
However, increasing activity 2 duration and adjusting resource assignments, we got a 10-days schedule without resource overloads.
So, automatic schedule adjustment and optimization is available for Spider Project users. Users of other scheduling tools can only do it manually. They need to seek such opportunities among the activities with Start-to-Start successors.
3.4. Resource requirements optimization
In our sample project we have optimized resource usage by increasing activity duration and changing the number of assigned resources.
This possibility is present for activities with positive start or finish flexes.
Besides, resource constrained schedule can be calculated using different algorithms that provide different results. The software that creates shorter schedules can save a fortune to its users.
Hence, you can be interested in a study of resource constrained scheduling capabilities of popular scheduling tools at https://www.planningplanet.com/forums/planning-scheduling-programming-discussion/574396/comparison-resource-levelling-algorithms-di
Creating CPM or resource level project schedule model is only the first step towards schedule optimization. Project duration and resource requirements can have better results with these.

PMP, GPSF, GCMF, Founder of Moscow, Russia PMI® Chapter
General Manager of Spider Project Team – the leading Russian project management consulting company with branches an partners in Russia, Brazil, Colombia, Kazakhstan, Romania, and Ukraine.
Spider Project Team developed Spider Project, most powerful professional Project Management software package that is now used in 36 countries.
An author of 4 books and more than 150 papers on Project Management.
Speaker at many PMI® and IPMA Congresses and Conferences since 1994.
Involved in management of many large scale projects including the development of Russian Pacific Area, preparation for 2014 Winter Olympic Games, construction of all stadiums for 2018 FIFA World Cup, etc.
Has an experience of managing projects in many application areas including aerospace, construction, mining, manufacturing, oil&gas, shipbuilding, software development, telecommunications.


