

What is a Risk Matrix Excel Template? How to Make a Risk Assessment Matrix in Excel? This is not just any table. It is a map in which you can draw the coordinates of every possible danger. With this map, you carefully assess each risk based on two critical factors. And these are its likelihood and possible influence on your project’s progress.
Table of Contents
excel templates for Risk Assessment
Why Use a Risk Matrix Excel Template? Using a risk matrix Excel template is like having a consultant by your side. It provides a clear visual representation of the challenges ahead. But it also empowers you to prioritize your efforts. It’s the compass that guides you through the choppy waters of risk management.
Understanding the Risk Assessment Matrix
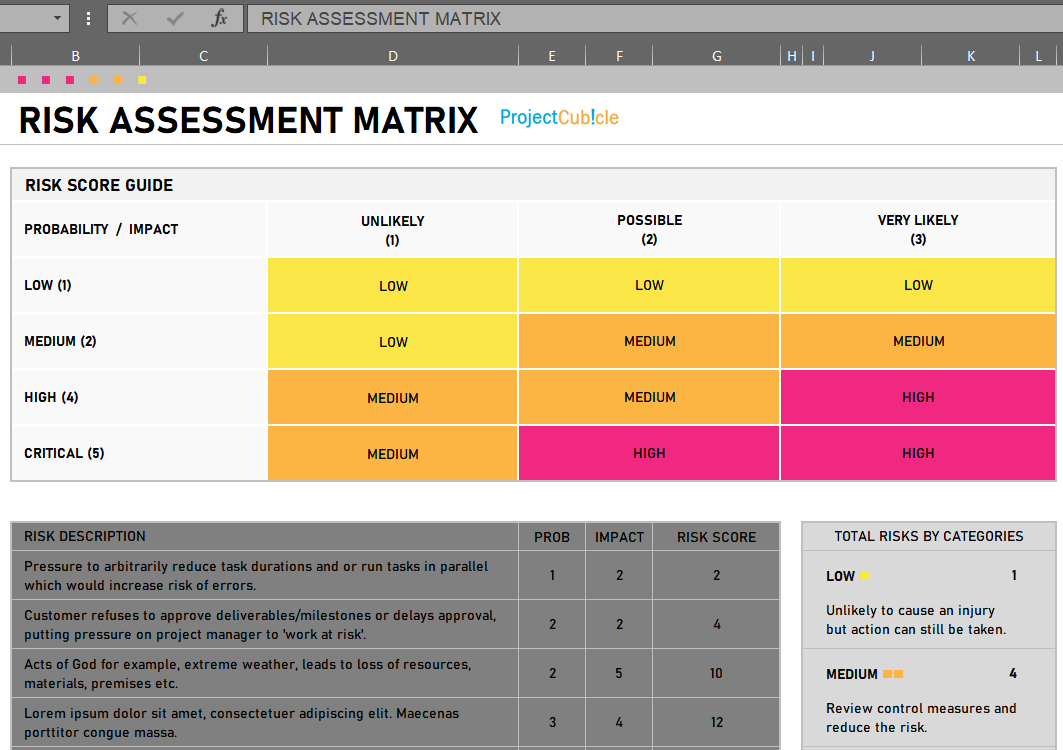
In the world of project management, a risk assessment matrix is your compass. In Excel, it takes the form of a table. But not just any table. It is a calculated arrangement and you can list all imaginable risks and evaluate them based on two critical factors. These are the likelihood of each risk happening and the impact it would have.
When you craft a risk matrix excel template, you are plotting the coordinates of each potential risk.
What is a Risk Matrix?
A Risk Matrix Excel Template is used across industries to visualize and manage risks. It serves as a graphical representation of potential risks. And this is categorizing them based on their likelihood and impact. This categorization allow you to prioritize risks and allocate resources. The matrix typically consists of a grid with likelihood levels on one axis and impact levels on the other. A risk matrix facilitates better understanding and communication among all project members.
Why Use a Risk Matrix?
Risk Matrix Excel Template offers numerous advantages to organizations. Firstly, you can identify and prioritize risks by categorizing them based on likelihood and impact. This prioritization ensures that attention and resources are directed towards high-risk areas.
Secondly, a risk matrix serves as a powerful communication tool. This visual representation supports clarity as project members can quickly understand the implications of different risk scenarios.
How to Create a Risk Matrix in Excel
Creating a risk matrix in Excel is a simple process.
1. Open Excel Spreadsheet:
- First, you should begin by launching Microsoft Excel on your computer. For instance, you can click on the Excel icon from your desktop or Start menu.
- Once Excel is open, you need to create a new spreadsheet.

2. Set Up Columns:
- In the first row of your spreadsheet, you should define column headers for various elements of risk management. For example, you might have columns labeled Risk ID, Description, Likelihood, Impact, Risk Rating, Mitigation Strategy and Status.
- Now, you can customize the column headers based on the specific aspects of risk management.

3. Enter Risk Data:
- It is time to add the details of each risk into the spreadsheet. Each risk should have a unique identifier in the “Risk ID” column. Such as Risk 001, Risk 002, and so on.
- In the “Description” column, it helps to describe each risk in detail.
- Next, assessing the likelihood and impact of each risk using a simple scale of low, medium or high can be useful. These assessments go into the “Likelihood” and “Impact” columns.
- Finally, calculating the risk rating for each risk is multiplying the likelihood and impact scores. And then you should put that result in the “Risk Rating” column.

4. Create Risk Matrix:
- If you wanna visualize the risk ratings, you should create a risk matrix in a separate area of the spreadsheet. This matrix will provide a graphical representation of the likelihood and impact of each risk.
- Now, you can organize the likelihood levels (e.g., low, medium, high) along one axis of the matrix and the impact levels along the other axis.

5. Apply Conditional Formatting:
- You should use conditional formatting to automatically format cells in the risk matrix based on the risk ratings entered.
- And you can assign different formatting styles. Such as colors or icons to represent low, medium and high-risk levels.

6. Link Cells:
- Next step is establishing links between the risk ratings in the main table and corresponding cells.
- You can use Excel formulas like VLOOKUP or INDEX/MATCH to bring risk ratings from the main table and after, you may populate the cells in the risk matrix dynamically.

7. Mitigation Strategies and Status:
- Now, allocate columns in the main table for documenting mitigation strategies.
- You will also provide options for data entry in these columns. Such as drop-down lists for selecting predefined mitigation strategies or status updates. Or free text entry for adding custom information.
8. Format and Customize:
- You can enhance the appearance of spreadsheet by formatting it in a smart way.
- For example, you can add borders, colors and styles to differentiate sections.
- But you should ensure that the layout is simpl with clear labels.
9. Test and Review:
- Before finalizing the risk management matrix, thoroughly test its functionality with sample data.
- You may also review the spreadsheet for any errors.
5×5 risk Matrix Template Excel Free
You can download a 5×5 risk matrix template Excel free from projectcubicle.com. This template is a good resource for organizations seeking for better risk management processes.
- 5×5 Risk Matrix Template Excel Free Download
- Free Download 5×5 Risk Matrix Template Excel
- Get Your 5×5 Risk Matrix Template Excel Now
After downloading 5×5 risk matrix template Excel free / Matrix Template Excel Free Download from projectcubicle.com, you can expedite your risk management efforts.
Why Choose Our Matrix Template Excel?
With our Risk Matrix Excel Template, you gain access to an intuitive tool designed to streamline your risk management efforts. Here’s why it stands out:
- Ease of Use: You will not deal with complicated setups or confusing processes. This template is all about being user-friendly.
- Flexibility: Whether you are just starting out or you are an Excel whiz, this template works for everyone. It’s easy to customize for every project.
- Efficiency: In project management, time is precious. This template saves you time by offering a structured way for risk assessment.
- Visual Clarity: With a clear and visually appealing design, our Matrix Template is simple to identify and understand the risks.
How to Make a Risk Assessment Matrix in Excel: Start
Working with our Matrix Template Excel is quick and simple. You should just follow below steps.
- Download: The Matrix Template Excel file can be downloaded by clicking the link below.
- Customize: You can adjust it to fit your project needs by adding or removing elements.
- Input Data: Risk data, including likelihood, impact and other relevant information can be entered into cells.
- Analyze: The template helps in assessing and prioritizing risks based on their likelihood and impact.
Download Now and Elevate Your Risk Management Efforts!
You can download our excel templates today to overcome challenges of project management with confidence. Click below to reach those templates.
FAQs About Risk Management in Excel
How do you create a risk matrix Excel Template?
Creating a risk matrix involves several steps as below.
- Define Risk Categories: You should determine the categories you will use to assess risks. These typically include likelihood and impact.
- Set up a Grid: You can create a grid in Excel with likelihood levels on one axis. Such as low, medium and high. And impact levels on the other such as minor, moderate and severe.
- Assign Values: It is possible to assign numerical values or scores to each level of likelihood and impact. For example, you might use a scale of 1 to 5, with 5 representing the highest likelihood or impact.
- Plot Risks: So, you should plot each identified risk on the grid based on its likelihood and impact. This will determine its position within the matrix.
- Color Code: Then, you will apply conditional formatting or color-coding to the cells.
- Analyze and Prioritize: Now, you should analyze the position of each risk within the matrix and prioritize them based on their location. Such as risks in the high likelihood/high impact quadrant may require immediate attention.
Is there a risk assessment Matrix template in Excel?
Yes, there are many risk assessment templates available in Excel. These templates often include pre-defined sections for identifying and evaluating risks. They are all ready for assessing likelihood and impact, calculating risk scores and documenting mitigation strategies. You can find these templates online or create your own based on your specific needs.
What is a risk matrix in Excel? Matrix Template Excel Free Download
A Risk Matrix Excel Template is a visual representation of risks based on their likelihood and impact. It typically consists of a grid. Here, the risks are plotted according to their likelihood and impact. Excel can create and manipulate risk matrices easily.
How to calculate risk in Excel?
If you wanna calculate risk in Excel, you need to assess two main factors. These are likelihood and impact. You can assign numerical values or scores to each factor. Then, you will multiply the likelihood score by the impact score to obtain a risk rating.
For example, if likelihood is rated on a scale of 1 to 5 and impact is rated on a scale of 1 to 5, the risk rating would be the product of these two scores. Such as likelihood score of 4 multiplied by impact score of 3 equals a risk rating of 12.
How do you create a 3×3 matrix in Excel?
- Creating a 3×3 matrix in Excel is pretty basic.
- First, you open Excel and start a new worksheet.
- Next, you enter the data you want in the matrix into nine adjacent cells.
- Once the data is in place, you can highlight those cells and use Excel’s formatting options to make the matrix look nice.
- Such as changing font styles, adding borders and adjusting colors as you like.
- Finally, adding labels for the rows and columns will help everyone understand what each part of the matrix represents.
What is a 4×4 risk matrix?
A 4×4 risk matrix categorizes risks based on four levels of likelihood and four levels of impact. It typically consists of a 4×4 grid. And here, the risks are placed based on their likelihood and impact levels.
Comparing different data types such as text and numbers can lead to errors in results. So it is your duty to ensuree data types in your conditions match what you are testing against.
Is a pivot table a matrix?
While a pivot table in Excel can summarize and analyze data in a tabular format, it is not typically considered a matrix. Pivot tables can aggregate and manipulate data dynamically. But they do not have the same structure or visual representation as a traditional matrix.
How do you make a matrix formula?
If you want to create a matrix formula in Excel, you can use existing functions like SUMPRODUCT, INDEX or VLOOKUP to perform calculations.. These formulas can manipulate and analyze data within the matrix. Also, they are capable of performing tasks such as calculating totals, finding specific values or generating summary statistics.
Conclusion: How to Make a Risk Assessment Matrix in Excel
In conclusion, understanding and managing risks are essential components of success in both personal and professional projects.
Risk management can be about safeguarding financial investments, protecting against cybersecurity threats or ensuring the safety of space exploration missions.
With these tools and frameworks such as risk matrices, organizations and individuals can identify, assess and mitigate risks. Thereby, they are maximizing opportunities for growth while minimizing potential pitfalls.
Matrix Template Excel Free Download
Now, you can Download our Matrix Template Excel now and start your projects with confidence.

A dedicated Career Coach, Agile Trainer and certified Senior Portfolio and Project Management Professional and writer holding a bachelor’s degree in Structural Engineering and over 20 years of professional experience in Professional Development / Career Coaching, Portfolio/Program/Project Management, Construction Management, and Business Development. She is the Content Manager of ProjectCubicle.


