10 Proven Strategies to Identify Duplicates in Excel: Enhance Your Data Management Skills
Navigating through extensive datasets in Excel can often lead you to a common yet critical challenge: identifying duplicates. Whether you’re consolidating reports, analyzing surveys, or managing inventories, duplicates can skew your results and disrupt your data integrity. Fortunately, Excel offers several powerful tools and techniques to find and manage these duplicates, ensuring your data remains pristine and reliable. This guide will walk you through 10 proven strategies to find duplicates in Excel, bolstering your data management skills.
Table of Contents
Understanding Duplicates in Excel
Before diving into the strategies, it’s crucial to understand what constitutes a duplicate in Excel. Duplicates can range from repeated values in a single column to identical rows across multiple columns. Identifying these effectively requires a keen eye and a thorough understanding of your dataset’s structure.

how to find duplicate in excel
Strategies to Find Duplicates in Excel
Conditional Formatting
One of the simplest ways to spot duplicates in Excel is through Conditional Formatting. This feature allows you to highlight duplicate values visually, making them stand out in your dataset.
- Select Your Data Range: Click and drag to select the cells you want to check for duplicates.
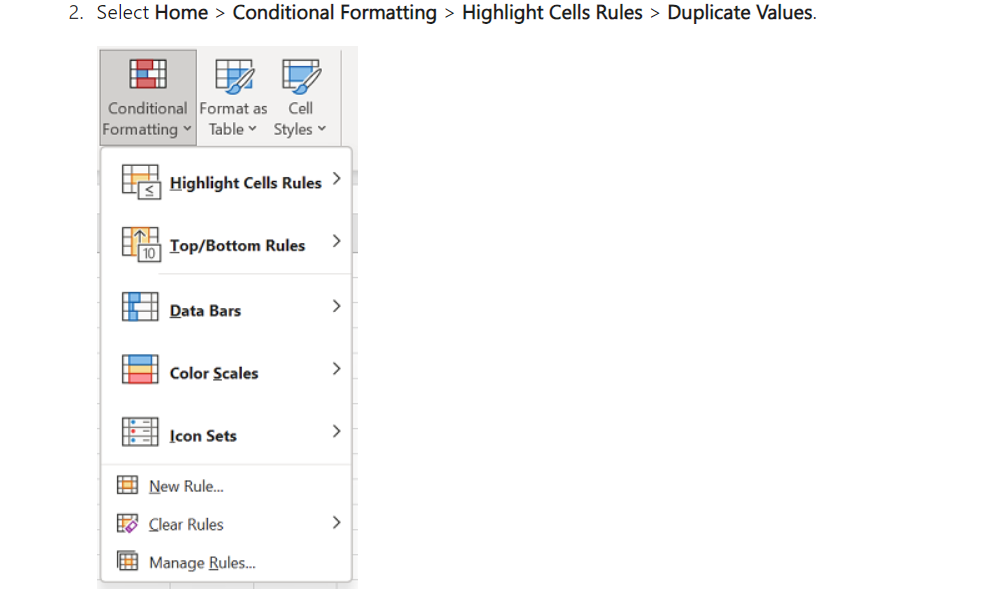
- Navigate to Conditional Formatting: Go to the Home tab, click on Conditional Formatting, and choose “Highlight Cells Rules.”
- Choose ‘Duplicate Values’: From the dropdown, select “Duplicate Values.” Excel will offer you formatting options to highlight duplicates, such as using a specific color.
- Apply Your Formatting: After selecting your preferred format, click OK. Excel will immediately highlight the duplicates in your selected range.

how to find duplicate in excel tutorial
Using Excel Formulas
For those who prefer a more hands-on approach, Excel formulas can be incredibly versatile in identifying duplicates.
- COUNTIF Function: This function counts the number of times a specific value appears in a range. By applying a
COUNTIFformula, you can flag cells with values that appear more than once.
=COUNTIF(range, criteria) > 1
- Combining IF and COUNTIF: To make the output more intuitive, you can combine
IFandCOUNTIFto display a message or value indicating a duplicate.
=IF(COUNTIF(A:A, A2)>1, "Duplicate", "")

remove duplicates in excel
Using the Remove Duplicates Feature
Excel’s built-in “Remove Duplicates” feature is a straightforward tool for eliminating duplicate rows from your dataset.
- Select Your Data: Click on the range or table from which you want to remove duplicates.
- Go to the Data Tab: Click on “Remove Duplicates” under the Data Tools section.
- Configure Your Selection: Choose whether you’re removing duplicates based on one column or multiple columns.
- Execute the Removal: Click OK, and Excel will remove the duplicates, leaving you with a unique set of data.
Advanced Filtering for Duplicates
Advanced Filtering is a powerful feature in Excel that allows you to filter for unique records or find duplicates that meet specific criteria.
- Set Your Data Range: Select your dataset.
- Go to Data > Advanced: Under the Sort & Filter group, click on “Advanced.”
- Configure Your Filter: Choose “Copy to another location,” specify your criteria, and select “Unique records only” if you’re looking for unique values.
- Apply the Filter: Excel will filter your dataset based on your settings, helping you isolate or remove duplicates.
Using Power Query to Find Duplicates
For larger datasets, Power Query offers a robust platform for data manipulation, including finding and removing duplicates.
- Load Your Data into Power Query: Go to the Data tab, select “From Table/Range” to open your data in Power Query Editor.
- Remove Duplicates: In the Power Query Editor, select the column(s) you want to check for duplicates, then click “Remove Duplicates” in the Home tab.
- Apply Changes: Once done, close the Power Query Editor, and apply the changes to your dataset.
How do I find duplicates in Excel spreadsheet?
Using Conditional Formatting:
- Select the range where you want to find duplicates.
- Go to the Home tab, click on Conditional Formatting > Highlight Cells Rules > Duplicate Values.
- Choose a formatting style and click OK. Excel will highlight the duplicates in your selected range.
How do I filter duplicates in Excel?
Using Advanced Filter:
- Select your data range.
- Go to the Data tab and click on Advanced in the Sort & Filter group.
- In the Advanced Filter dialog box, select “Copy to another location.”
- Check the “Unique records only” box and specify where you want to copy the filtered data.
- Click OK to filter out duplicates.
How do I find total duplicates in Excel?
Using COUNTIF Function: To count how many times a value appears in a range, use the COUNTIF function:
=COUNTIF(range, criteria)
To total duplicates for a specific value, replace “criteria” with the value you’re counting. To find total duplicates in a range, apply this formula in a new column alongside each value.
What is the best formula to find duplicates in Excel?
Combining COUNTIF with Conditional Formatting:
- Use the COUNTIF function to mark duplicates:
=COUNTIF(A:A, A2)>1
- Apply this formula using Conditional Formatting to visually highlight duplicates in a column.
How do I find duplicates in Excel without removing them?
Using Conditional Formatting or Formulas:
- Conditional Formatting can highlight duplicates without altering your data.
- Use a formula in an adjacent column to identify duplicates, for example:
=IF(COUNTIF(A:A, A2)>1, "Duplicate", "")
How do I find duplicates in a table?
Using Excel Table Feature and Conditional Formatting:
- Convert your range to a table by selecting the range and pressing Ctrl + T.
- Apply Conditional Formatting to highlight duplicates within the table, following the same steps as above.
How do you calculate duplicates?
Using Formulas:
- To calculate the number of duplicate entries for a specific value, use COUNTIF as mentioned before.
- To flag duplicates, use:
=COUNTIF(A:A, A2)>1
This formula returns TRUE for duplicates and FALSE for unique values.
How do you check if a set has duplicates?
Using Conditional Formatting or a Formula:
- Apply Conditional Formatting to the entire set to visually identify duplicates.
- Or, use a helper column with a COUNTIF formula to flag duplicates. If any cell in this column shows a value greater than 1, your set has duplicates.
How do I find duplicates in a dataset?
Using Power Query:
- Select your range and go to the Data tab > Get & Transform Data group > From Table/Range.
- In the Power Query Editor, select the column(s) you wish to check for duplicates.
- Go to the Home tab, and use the Remove Duplicates or Keep Duplicates button depending on your need. This will help you identify or eliminate duplicates in your dataset.
Each of these methods provides a robust way to manage duplicates in your Excel datasets, ensuring your data analysis is accurate and meaningful. Whether through conditional formatting, specialized formulas, or the powerful features of Power Query, Excel offers a variety of tools to effectively highlight, count, and filter duplicates according to your specific data management needs.
Conclusion
Identifying and managing duplicates is an essential skill in Excel data management. By leveraging Excel’s built-in features, formulas, and Power Query, you can efficiently find and remove duplicates, maintaining the integrity of your datasets. Whether you’re a novice or an experienced Excel user, these strategies will empower you to handle duplicates with confidence, paving the way for more accurate and insightful data analysis.
Dear Readers,
In our journey through the intricate world of data analysis in Excel, from unraveling the complexities of Z-tests to demystifying p-values, we’ve covered a significant expanse of statistical ground. These tools, as we’ve seen, are not just mathematical functions; they are the lenses through which we can discern patterns, make predictions, and ultimately, drive decision-making processes in businesses, research, and beyond.
As we continue to explore and share insights on project management, risk analysis, and other pivotal topics at projectcubicle.com, your feedback, questions, and experiences are invaluable to us. They not only enrich our community but also inspire us to delve deeper, pushing the boundaries of our content to better serve your needs and curiosities.
We Need Your Support
But to keep this mission thriving, we need more than just intellectual engagement; we need your support. Whether it’s by sharing our articles with peers, contributing your expertise through guest posts, or simply engaging with our content on social media, every action you take helps us grow and continue providing valuable resources.
Your insights and experiences could be the beacon for someone navigating their project management journey. So, we encourage you to share, comment, and connect. Let’s build a community that not only seeks knowledge but also supports each other in the quest for excellence.

motivations
Hello, I’m Cansu, a professional dedicated to creating Excel tutorials, specifically catering to the needs of B2B professionals. With a passion for data analysis and a deep understanding of Microsoft Excel, I have built a reputation for providing comprehensive and user-friendly tutorials that empower businesses to harness the full potential of this powerful software.
I have always been fascinated by the intricate world of numbers and the ability of Excel to transform raw data into meaningful insights. Throughout my career, I have honed my data manipulation, visualization, and automation skills, enabling me to streamline complex processes and drive efficiency in various industries.
As a B2B specialist, I recognize the unique challenges that professionals face when managing and analyzing large volumes of data. With this understanding, I create tutorials tailored to businesses’ specific needs, offering practical solutions to enhance productivity, improve decision-making, and optimize workflows.
My tutorials cover various topics, including advanced formulas and functions, data modeling, pivot tables, macros, and data visualization techniques. I strive to explain complex concepts in a clear and accessible manner, ensuring that even those with limited Excel experience can grasp the concepts and apply them effectively in their work.
In addition to my tutorial work, I actively engage with the Excel community through workshops, webinars, and online forums. I believe in the power of knowledge sharing and collaborative learning, and I am committed to helping professionals unlock their full potential by mastering Excel.
With a strong track record of success and a growing community of satisfied learners, I continue to expand my repertoire of Excel tutorials, keeping up with the latest advancements and features in the software. I aim to empower businesses with the skills and tools they need to thrive in today’s data-driven world.
Suppose you are a B2B professional looking to enhance your Excel skills or a business seeking to improve data management practices. In that case, I invite you to join me on this journey of exploration and mastery. Let’s unlock the true potential of Excel together!
https://www.linkedin.com/in/cansuaydinim/


