How do you create a network diagram in Excel?
The Essence and Utility of Network Diagrams
At its core, a network diagram is a strategic map of a project’s tasks. It is depicting how each task is interlinked with others. These diagrams serve as the compass guiding project managers through dependencies, timelines and resources.
Table of Contents
Important points to consider when creating a network diagram in Excel:
- You should ensure that your diagram is clear and easy to understand. Also, you must use consistent labeling and formatting to make it visually appealing.
- When working on your network diagram, it is really important to check your data and connections. Mistakes can lead to misleading representations of your network.
- Also, you should think about scalability. Depending on how big and complex your network is, you might change the layout or use some extra tools to create a more detailed diagram.
- Lastly, it’s a good idea to keep your diagram updated as your network changes.

Open a network diagram template in Microsoft Visio:

- Go and open Microsoft Visio.
- You need to select “File” from the menu.
- Now, choose “New” from the options.
- In the template categories, you need to select “Network.”
- Also, you should go and choose “Basic Network Diagram” from the available templates and click Create.
Turn on AutoConnect:
- Now, go to the “View” tab.
- And select “AutoConnect” from the options.
Show connection points:
- Now you should find View tab.
- And then, select Connection Points from the options.
Add shapes:
- You can drag shapes onto the drawing page from the Network and Peripherals and Computers and Monitors stencils.
- You can find more network stencils by selecting More Shapes > Network.
Label shapes:
If you wish to add a label to a shape, you just click on the shape and type your text. If you want to move the text around, you can select the shape and drag the yellow text handle until the spot. Once you are happy with the placement, clicking on a blank spot on the drawing page will finish the labeling.
Draw connections between shapes:
- To connect two shapes, you should start by clicking on the Home tab.
- Then, you pick the Connector tool and draw a line between the shapes you want to link.
- Once you are done drawing the line, you just switch to the Pointer Tool.
Add a legend:
If you need to add a legend to your drawing, you should grab the legend shape from the Network and Peripherals stencil and drag it onto the page.
Next, you click on Legend Subtitle and type in a new subtitle for it.
Why Excel Reigns Supreme for Network Diagrams: Can Excel do network analysis?
Even with so many specialized diagramming tools out there, Excel remains a popular choice for making network diagrams. Here’s why it stands out:
- First off, many people are already familiar with Excel. This makes it easier to learn how to create network diagrams.
- While it may not have all the fancy features, Excel does offer basic drawing tools like shapes and lines. So, you can easily put together simple network diagrams.
- Another plus is the customization options. Users can adjust shapes, colors and formatting to fit their specific needs.
- Excel also integrates smoothly with data sources. Hence it is good for dynamic diagrams updating in real time.
- Lastly, since Excel is part of the Microsoft Office suite, there is no extra cost to create network diagrams.
Leveraging Advanced Tools for Network Diagrams
While Excel is a powerful ally, some projects demand the specialized capabilities of tools like MS Visio or Draw.io. These platforms offer more options for crafting network diagrams.
- Visio Network Topology is especially useful for IT and network projects. Because it helps users understand both the physical and logical layouts of networks. It comes with templates and shapes for network diagrams.
- MS Visio also offers advanced diagramming features for a polished and professional look. With its large library of shapes and powerful linking and layering options, users can create detailed and dynamic network diagrams.
- For a web-based option, Draw.io is a good alternative. It has an easy-to-use interface and extensive template library. This lets users quickly create network diagrams without installing any software.
- If project management is a priority, MS Project integrates network diagramming right into its platform. You can easily visualize tasks and dependencies. And it even has an automatic diagram generation feature that can save time.
network_diagram_template
Types of Network Diagrams in Excel
If you wanna create a network diagram in Excel, you should understand different types of them for various project needs. Network diagrams are essential tools in project management. Because they visualize tasks and their interdependencies.
Excel tough allows for the creation of several types of network diagrams. Each of them is serving distinct purposes. Below, you can see common types of network diagrams you can create in Excel. These diagrams can be a solid foundation for project visualization and management.
1. Activity on Node (AON) Diagrams
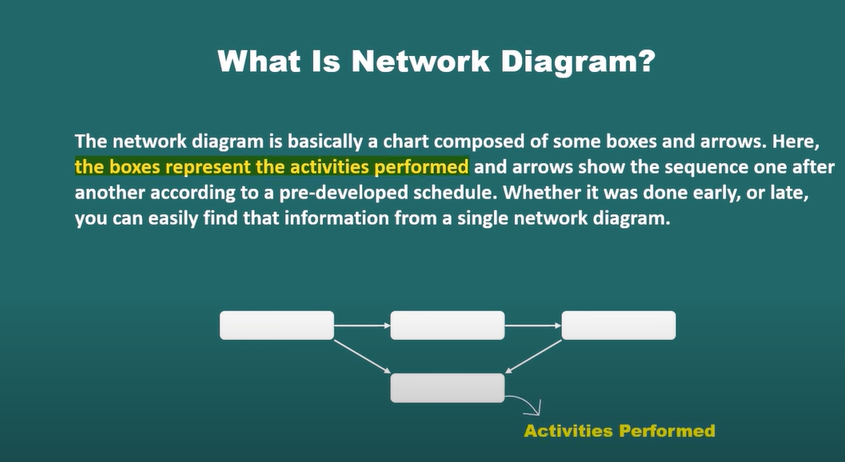
AON diagrams, also known as Precedence Diagramming Method (PDM) are popular in project management. In these diagrams, nodes represent the activities or tasks. And arrows show the relationships or dependencies between these tasks.
This type of diagram is useful for illustrating the sequence of tasks. They can also be handy for identifying the critical path and understanding task dependencies. Creating an AON diagram in Excel is about using shapes to represent activities and connectors to denote dependencies. So at the end, this is offering a clear visualization of the project’s workflow.
2. Activity on Arrow (AOA) Diagrams
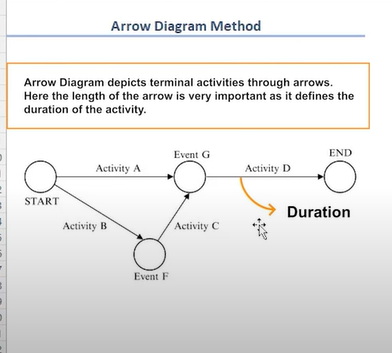
Unlike AON diagrams, AOA diagrams or Arrow Diagramming Method (ADM), use arrows to represent tasks. Also, they use nodes to denote the start and end points of these tasks. This approach is beneficial for visualizing the flow of activities and understanding the dependencies.
Although AOA diagrams can be more challenging to create in Excel. Because they heavily rely on arrows for tasks. But they can still be constructed using a combination of shapes for nodes and lines with arrowheads.
Network Diagram in Excel
While not a network diagram in the traditional sense, Gantt charts are closely related to this. And they can be created in Excel. They provide a timeline view of the project. This works for showcasing when tasks are scheduled to start and finish and overlap. Gantt charts are common tools in project planning and tracking. Because they are offering a temporal perspective and this complements the structural insights of AON and AOA diagrams.
4. Critical Path Method (CPM) Diagrams
CPM diagrams focus on identifying the longest path of planned activities to the end of the project. They are highlighting the tasks directly impacting the project’s completion time. These diagrams are crucial for project managers to prioritize tasks and allocate resources without waste. In Excel, CPM diagrams can be constructed similarly to AON diagrams. But you will have additional emphasis on calculating and visualizing the duration of each path. So, you can determine the critical path.
5. Resource Allocation Diagrams
Resource allocation diagrams are a variant of network diagrams. These not only show the sequence and dependencies of tasks. But they also include information about resource allocation to each task. This type of diagram has great value for ensuring efficient resource usage. Also, you can make sure that the project’s resource demands do not exceed available capacities.
In Excel, resource allocation diagrams can be created by adding resource information to the nodes in an AON diagram. This will be providing a bigger view of both task scheduling and resource management.
- Creating a diagram in Excel is pretty simple. You can begin with a blank spreadsheet as your canvas. It’s often helpful to list all your project tasks along with their dependencies. Yet, you need to it before you start visualizing them.
- Next, you can use shapes to represent different tasks or events. You should just head over to the Insert tab, select Shapes and pick the shapes you want.
- To show how the tasks connect, arrows can indicate the flow or sequence. You will find those under Shapes as well.
- In case you want, customizing your diagram is easy. You can adjust the size, color and text in each shape to add more information.
Network diagram template Excel free download:
You can find downloadable network diagram templates for Excel online. These templates offer layouts, shapes and connectors. Hence, you can save time while creating professional-looking network diagrams. Websites like projectcubicle.com provide a variety of templates and you can download for free to start your diagrams.
network_diagram_template
Network diagram Excel template:
While Excel lacks specialized templates for network diagrams, it is yet a good tool. You can create network diagrams from scratch using its shapes and drawing tools. Hence, it is good for customizing diagrams to suit your needs. Also, you can visit projectcubicle.com to explore a range of Excel templates. We are including those for network diagrams.
Draw network diagram:
Drawing a network diagram in Excel happens with its drawing tools to create and connect shapes representing different network elements. You can arrange and format these shapes to create clear and organized diagrams. Project management websites like projectcubicle.com offer tutorials and tips on how to draw network diagrams using Excel.
Network Diagram Excel:
Excel is a powerful tool for creating and analyzing network diagrams. Functions such as conditional formatting and formula calculations can really help you out. These can enhance your diagrams. For additional resources and templates, you may consider visiting projectcubicle.com to enhance your Excel skills for network diagram creation.
How to draw CPM network diagram:
To draw a Critical Path Method (CPM) network diagram in Excel, you should break down the project into tasks, identify dependencies and durations. And next, you will use Excel‘s drawing tools to create a visual representation. This helps in planning and managing project timelines. Project management platforms like projectcubicle.com offer tutorials and guides on creating CPM network diagrams using Excel.
How to make CPM chart in Excel:
Creating a CPM chart in Excel is about organizing project tasks in a table format. And using Excel‘s charting tools to visualize the schedule and critical path. This helps in communicating the project timeline and identifying delays. You can explore projectcubicle.com for step-by-step guides for creating CPM charts in Excel.
Project network diagram generator:
While Excel can generate project network diagrams, specialized project management software like Microsoft Project or Primavera P6 offers more features. These tools are for project planning and scheduling. Hence, they are already providing templates and tools for creating and analyzing project network diagrams. For those looking to use Excel for project management, projectcubicle.com offers resources and tutorials about Excel network diagrams and managing project tasks.
creating a network diagram without Visio
Apart from Excel, there are several alternatives to Visio for creating network diagrams:
- Draw.io/diagrams.net: A free, web-based diagramming tool.
- Lucidchart: It offers both free and paid plans with plenty of templates.
- yEd Graph Editor: This is a powerful tool and also free to use.
Which software to draw a network diagram?
Besides the already mentioned Excel, Visio, Draw.io and Lucidchart, other software options include:
- Gliffy: Web-based and it offers intuitive diagramming tools.
- Creately: This tool is known for its collaboration features and extensive template library.
- Edraw Max: This one offers versatile diagramming capabilities across various diagram types.

A dedicated Career Coach, Agile Trainer and certified Senior Portfolio and Project Management Professional and writer holding a bachelor’s degree in Structural Engineering and over 20 years of professional experience in Professional Development / Career Coaching, Portfolio/Program/Project Management, Construction Management, and Business Development. She is the Content Manager of ProjectCubicle.


Create Network Diagram, Workflows & Relationship Diagram Online for Free. https://network-diagram.net/