A Practical Explanation of Arrow Diagramming Method with an Example
Arrow diagramming method (ADM) is a network diagramming technique in which activities are represented by arrows.[1] ADM is also known as the Activity-On-Arrow (AOA) method. It has been used a long time to determine the critical path and identify resource problems and feasible solutions when the approximate duration and resource requirement of all the activities of the network diagram are known. In this Arrow Diagramming Method Example we will discuss the uses of arrow diagram and demonstrate the critical path calculation.
Table of Contents
Before to start, Explore Arrow Diagramming Method (ADM) with our illustrated example video. See how ADM visually represents the sequence of project tasks and their dependencies, helping project teams identify the critical path and improve project planning.
There are two main elements of the Arrow Diagramming Method(ADM) which are arrows and nodes. One arrow represents one activity to be performed. The tail of the arrow is the start of the activity, the head of the arrow is the end of the activity and the length of the arrow is the duration of the activity.
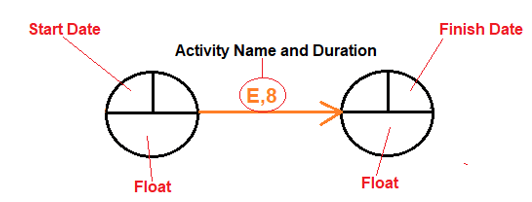
Activities
In the forward pass, we calculate the Start Dates of all the nodes. In the backward pass, the end node’s Start Date will be its Finish Date and the backward pass proceeds by subtracting the duration of the activities leading to the end node from the end node’s Finish Date to arrive at the Finish Dates for the preceding nodes.
Arrow Diagramming Method Example
The following example shows a simple Activity on Arrow Diagram.
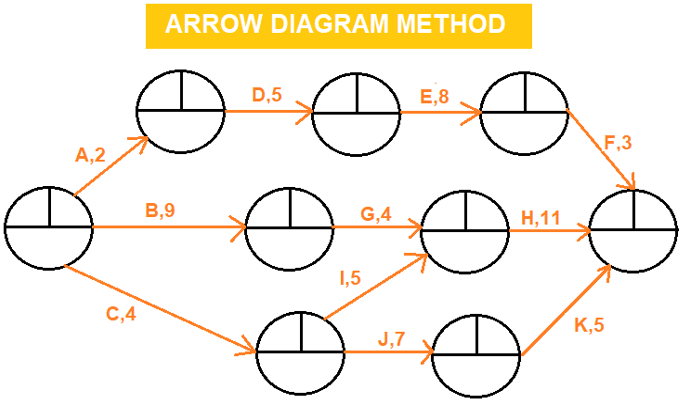
Activity on Arrow Diagram
In this example A,B,C,D,E,F,G rows are representing the activities. Numbers above the rows are activity durations. As shown in the schema above, in Arrow Diagramming Method(ADM), only F-S Relationship is used to link activities.
Arrow Diagramming Method Calculation Steps
Step 1: Forward Pass Calculation
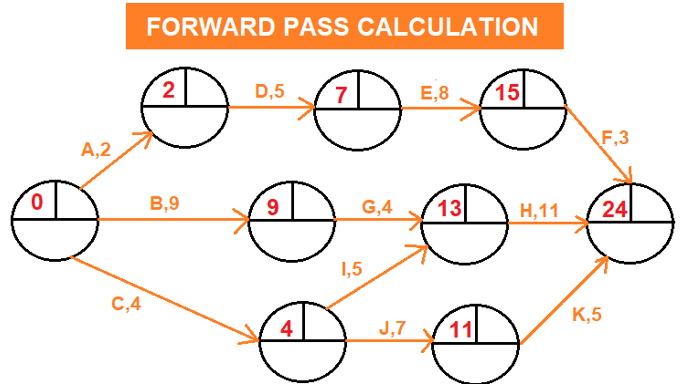
Forward Pass Calculation – Arrow Diagramming Method (ADM)
Step 2: Backward Pass Calculation
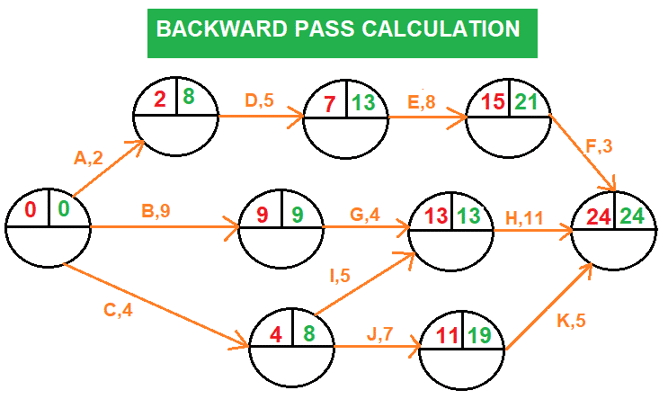
Backward Pass Calculation-Arrow diagramming method (ADM)
Step 3: Float Calculation for Each Activity / Arrow Diagramming Method Example
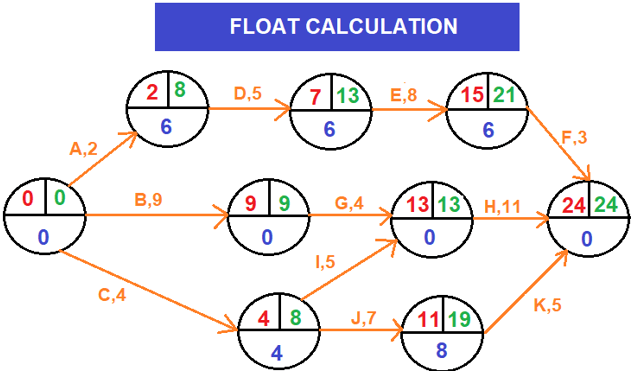
Float Calculation-Arrow diagramming method (ADM)
Float can be calculated by subtracting the Start Date of an activity from its Finish Date.
Step 4: Identifying the critical path / Arrow Diagramming Method Example
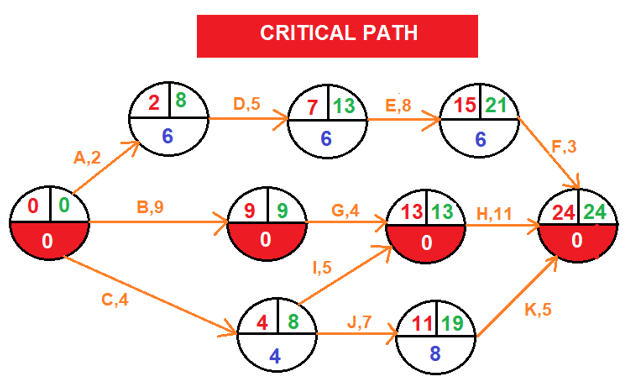
Critical Path-Arrow diagramming method (ADM)
The critical path is the longest path in the network diagram and the total float of critical path is zero. As shown in the schema above, the critical path is marked red.
Summary
The Arrow Diagramming Method (ADM) and The Precedence Diagramming Method (PDM) are two network scheduling techniques. The first one is the traditional one used widely in the past. The second one is the current method that we are using widely now. In this simple arrow diagramming method example we show how to make forward, backward, total float and critical path calculation. Nowadays the arrow diagramming lost its popularity because of the introduction of software solutions but in order to use this software successfully, it is important to understand both scheduling techniques.
See Also
External References
[1] CPM in Construction – A Manual for General Contractors (Copyright 1965 by the Associated General Contractors of America)

Irma Gilda is chief executive of Sonic Training and Consultancy Co., the training platform offers project planning and scheduling More than 60 k learners have used the platform to attain professional success. Irma is a professional Primavera P6 Trainer.

