Arrow Diagramming Method (ADM) in Scheduling
Arrow Diagramming Method (ADM) or Activity on Arrow Method (ADM) is a common scheduling technique used in project management like the precedence diagramming method (PDM). Humans are creating work schedules to track their project’s performance since the construction of the pyramids. In the beginning, they use quite simple techniques and charts to represent the work that needs to be done. After the usage of the first Gantt Charts which are the predecessors of the modern Gantt Charts, scheduling practices evolved and then project controls became an area of expertise. Unlike the first Gantt Charts, schedule network diagrams are created by establishing logical links between the activities in modern projects.
Table of Contents
Schedule Network Diagrams
A project network diagram of a work schedule demonstrates the logical order that the activities will follow. It shows a sequence of tasks and/or deliverables required to complete the project. Basically, there are two common techniques to create network diagrams. These techniques are Arrow Diagramming Method (ADM) (or Activity on Arrow) and Precedence Diagram Method (PDM) (or Activity on Node). Schedule network diagrams enable us to determine the critical path of the project. The critical path is the longest path where a delay on it results in a project delay.
Arrow Diagramming Method (Activity on Arrow Method) in Project Management
Arrow diagramming method (ADM) is a project network diagramming technique like the Precedence Diagram Method (PDM). Unlike the PDM, activities are shown as arrows on the diagram in this method. It has been used for a long time for determining the critical path, identifying resource problems, and analyzing feasible solutions when the approximate duration and resource requirement of all the activities are known.
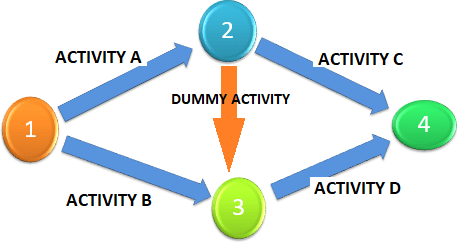
There are two main elements of the Arrow Diagramming Method (ADM) which are arrows and nodes. One arrow represents one activity to be performed. The starting point of the arrow represents the start of the activity and the ending point of the arrow represents the end of the activity. The length of the arrow represents the duration of the activity. For better understanding let’s analyze the schema below.
The circles numbered 1, 2, 3, and 4 are the nodes of this network system. They are the definable achievement in the project. Nodes have neither duration nor resource. Activities A, B, C, D are represented by the arrows. Each activity has a duration and allocated resource.
What is the Dummy Activity in Arrow Diagramming Method (ADM)?
A dummy task is not a real activity that is added to represent dependency between tasks. It can be used to separate tasks or to keep the sequence correct. The duration of a dummy task is often zero.
When to Use the Arrow Diagramming Method (ADM)
Arrow Diagramming Method (ADM) shows the logical order of activities that helps to determine the critical path and identify the main problems related to resources and delays. From this aspect, it can be used for schedule compression practices such as fast tracking and crashing.
Arrow Diagramming Method (ADM) can be used to plan and track the activities within a complex schedule that includes many resources. For a successful implementation, activity durations, their sequences, and project execution strategy must be clear.
How to Use the Arrow Diagramming Method (ADM)
Below steps are used in Arrow Diagramming Method (ADM)
- Identify all the activities required to complete the project and list them.
- Estimate the activity durations considering the crews and quantity of work. Estimating activity durations is an important process because activity durations affect the length of the critical path. There are some techniques to estimate activity durations. Expert judgment, analogous estimating, parametric estimating and three-point estimating are the techniques widely used to estimate the activity durations. Unlike other techniques, three-point estimates provide most likely, optimistic, and pessimistic estimates that are used for the PERT method.
- Determine the predecessor, successor activities, and logical sequences. While performing this step ask the questions below while using the arrow diagramming method;
– Which activity will start first?
– Which activities will be performed simultaneously?
– Which activity will finish after this activity?
– Which activity will start after this activity?
Creating a table and organizing the columns with this information may be useful to save time.
- Draw the network diagram by using the data created in the former steps. Draw the nodes for events that represent the beginning or end of an activity. These nodes separate the activities. Use dummy activities when needed and show them as dashed lines.
- Determine the critical path of the network diagram by performing forward pass and backward pass calculations.
- Calculate the ES (Earliest Start), EF (Earliest Finish), LS (Latest Start), LF(Latest Finish) dates for each activity.
- Calculate the Total Float and Free Float for each activity. Total float is the duration that a task (or an activity) can be postponed without delaying the project. Free float is the duration that a task can be postponed without delaying the ES of the successor activity. Float is also known as slack.
Total Float (TF) :LS – ES , LF – EF
Free Float (FF) : ES (of successors) – EF of current activity -1
Summary
The Arrow Diagram was a common visible and practical network diagramming method used in the past which was developed after the Gantt Charts (or bar charts). It was widely used in the past to identify the critical path of a complex project.
As a traditional project management technique, Arrow Diagramming Method (ADM)’ s popularity has fallen away because of the introduction of software solutions that can calculate the critical path of a project schedule easily and automatically. In this post, we make a short review of this important network diagramming method in scheduling. It is critical to understand the logic of network diagrams to create better schedules. For more, you can read the article related to the Arrow Diagramming Method Example.
External References
[1] CPM in Construction – A Manual for General Contractors (Copyright 1965)
See Also
Precedence Diagramming Method Example

Irma Gilda is chief executive of Sonic Training and Consultancy Co., the training platform offers project planning and scheduling More than 60 k learners have used the platform to attain professional success. Irma is a professional Primavera P6 Trainer.




I couldn’t refrain from commenting. Very well written!
Wow, that’s what I was seeking for, what a data! existing here at this weblog, thanks admin of this site.