How do I calculate XIRR in Excel?
How do I calculate XIRR in Excel? In the intricate world of financial analysis, accurately gauging the return on investments, especially those with cash flows at non-uniform intervals, is paramount. Excel’s Extended Internal Rate of Return (XIRR) function emerges as a beacon of precision, offering investors a nuanced tool to measure investment performance. This comprehensive guide is designed to unravel the complexities of XIRR, paving the way for enhanced investment insights and decision-making.
Table of Contents
Understanding XIRR in Excel

Excel-XIRR-Function-Formula
XIRR: The Gateway to Advanced Investment Insights
XIRR stands out in Excel’s suite of financial functions by calculating the internal rate of return (IRR) for a series of cash flows that may not be periodic. This capability is crucial for assessing the real-world viability of investments, from real estate ventures to bond portfolios.
Decoding the XIRR Syntax
The formula for XIRR in Excel is elegantly straightforward, requiring just two primary inputs alongside an optional guess parameter:
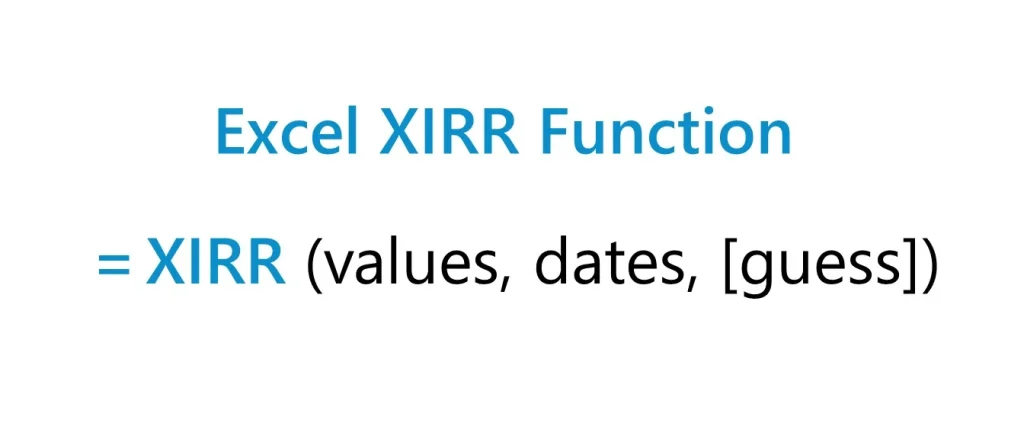
XIRR(values, dates, [guess])
Here, “values” represent the cash flow amounts, “dates” correspond to each cash flow’s occurrence, and “guess” is an initial estimate of the IRR, aimed at optimizing the function’s iterative algorithm.
The Importance of Correct Data Entry
For XIRR to yield accurate results, the “values” must include at least one negative value (typically the initial investment) and one positive value (returns). The “dates” should accurately reflect the timing of each cash flow, as even minor inaccuracies can significantly affect the outcome.
A Practical Example
Imagine an investor who makes an initial investment of $10,000 (recorded as a negative value) in a project and receives several irregular payments over the course of two years. Using XIRR, they can accurately calculate the project’s internal rate of return, considering the exact timing of each cash inflow and outflow.
Advancing Your Skills with XIRR
Strategic Investment Analysis with XIRR
XIRR transcends traditional financial metrics by accommodating irregular investment timelines, making it indispensable for dynamic investment analysis. It allows investors to accurately compute returns on ventures with non-standard cash inflow and outflow patterns, ensuring a comprehensive financial overview.
Leveraging XIRR for Comprehensive Financial Modeling
Integrating XIRR into financial models facilitates nuanced investment comparisons and strategy formulation. It is especially valuable in constructing detailed scenarios that reflect the timing of cash flows, enhancing the predictive accuracy of financial forecasts.
Combining XIRR with Other Financial Functions
For a more robust financial analysis, you can combine XIRR with functions like NPV (Net Present Value) or PMT (Payment) to assess the viability of investment opportunities from different angles. This multidimensional approach to financial modeling can uncover insights that might be overlooked with a singular analytical technique.
Real-World Applications of XIRR
Enhancing Personal Finance Management
For personal investors, XIRR acts as a critical tool in evaluating the performance of diverse investment portfolios, including stocks, mutual funds, and more. It offers clarity on the actual returns, factoring in the timing and magnitude of each transaction.
Optimizing Project Finance Decisions
Project finance professionals rely on XIRR to assess the viability of projects with complex funding structures and phased cash flows. By accurately measuring the return over the project’s lifecycle, XIRR aids in informed decision-making and financial planning.
XIRR in Real Estate Investment
Real estate investments often involve significant upfront costs followed by irregular income streams from rentals or a lump-sum sale. XIRR helps investors determine the internal rate of return on such investments, accounting for the varying cash flow timings, which is crucial for long-term strategic planning.
Tips and Tricks for Mastering XIRR
Navigating Common Pitfalls
Accuracy in XIRR calculations hinges on precise cash flow and date alignments. Ensuring chronological order and including at least one positive and one negative value in the series are foundational steps to avoid computation errors.
Enhancing XIRR Calculation Efficiency
A thoughtful initial guess can significantly expedite the XIRR calculation process. Furthermore, maintaining a structured and clean dataset, with clearly marked dates and cash flow values, streamlines analysis, making XIRR a more powerful tool in your financial analysis arsenal.
Avoiding Calculation Errors
Common errors in XIRR calculations can often be traced back to mismatched dates and values or incorrect data entry. Double-checking the cash flow series for accuracy and completeness can help mitigate these issues, ensuring reliable results.
Small Business Budget Tips for Cash Management – projectcubicle
How do I calculate XIRR in Excel?
Calculating XIRR in Excel involves the following steps:
- Prepare Your Data: List all cash flows in one column, including both your investments (negative values) and returns (positive values). In another column, list the corresponding dates for each cash flow.
- Use the XIRR Function: Click on an empty cell where you want the XIRR result to appear. Type in the XIRR formula:
=XIRR(values, dates, [guess]). For “values,” select the range of your cash flows. For “dates,” select the range of corresponding dates. The “guess” parameter is optional and is an estimate of the expected IRR. - Press Enter: Excel calculates the XIRR based on your inputs.
What does 20% XIRR mean?
A 20% XIRR means that the investment has generated an average annual return of 20%, taking into account the timing and magnitude of cash flows. This figure is a way to express the efficiency of the investment over the period it was held, considering all cash inflows and outflows at their respective times.
What is the difference between IRR and XIRR in Excel?
The primary difference between IRR and XIRR in Excel is how they handle the timing of cash flows:
- IRR assumes that all cash flows occur at regular intervals (e.g., annually, monthly). It’s suitable for situations where this assumption holds true.
- XIRR, on the other hand, is designed for calculating the internal rate of return for cash flows that do not occur at regular intervals. It allows for a more accurate analysis of investments with irregular cash flows by taking the exact dates of cash flows into account.
FAQs About XIRR in Excel
What is XIRR in Excel?
XIRR stands for Extended Internal Rate of Return. It is a function in Excel that calculates the internal rate of return (IRR) for a series of cash flows occurring at irregular intervals. XIRR is particularly useful for financial analysis in scenarios where cash flows do not happen at a standard, periodic rate.
How do I calculate XIRR in Excel?
To calculate XIRR in Excel:
- Organize your cash flow data in one column and the corresponding dates of these cash flows in another column.
- Click on an empty cell where you want the XIRR result to appear.
- Enter the XIRR function:
=XIRR(values, dates,[guess])where “values” are your cash flows and “dates” are the corresponding dates for these cash flows. The “guess” parameter is optional. - Press Enter, and Excel will display the XIRR for your data.
Can XIRR handle negative and positive cash flows?
Yes, XIRR can handle both negative and positive cash flows. In fact, for XIRR to work correctly, there should be at least one negative cash flow (usually the initial investment) and one positive cash flow (returns). The function calculates the rate of return assuming these cash flows happen at the specified dates.
What does a negative XIRR value indicate?
A negative XIRR value indicates that the investment resulted in a loss over the period analyzed. Instead of generating a return, the cash flows represent a net outflow of resources, suggesting that the total amount returned was less than the initial investment.
How does XIRR differ from IRR in Excel?
The main difference between XIRR and IRR in Excel is how they handle the timing of cash flows. IRR assumes that cash flows occur at regular intervals (such as monthly or yearly), making it suitable for analyzing annuities or equally spaced cash flows. XIRR, on the other hand, calculates the internal rate of return for cash flows that do not occur at regular intervals, taking into account the exact dates of each cash flow, thus providing a more accurate measure of return for irregular cash flows.
Is XIRR always accurate?
XIRR provides a highly accurate measure of the internal rate of return when the cash flows and their corresponding dates are correctly entered. However, the accuracy of XIRR can be affected by the distribution and timing of cash flows. Extreme variations in cash flow amounts or timing can lead to multiple solutions for the rate of return, potentially affecting the accuracy of the XIRR calculation.
How does the “guess” parameter affect XIRR calculation in Excel?
The “guess” parameter in the XIRR function is an optional argument where you can provide an estimate of the expected internal rate of return. Providing a guess can help Excel converge on the correct XIRR value more quickly, especially in cases where the calculation might be complex or slow. If omitted, Excel uses a default guess of 0.1 (or 10%).
Hello, I’m Cansu, a professional dedicated to creating Excel tutorials, specifically catering to the needs of B2B professionals. With a passion for data analysis and a deep understanding of Microsoft Excel, I have built a reputation for providing comprehensive and user-friendly tutorials that empower businesses to harness the full potential of this powerful software.
I have always been fascinated by the intricate world of numbers and the ability of Excel to transform raw data into meaningful insights. Throughout my career, I have honed my data manipulation, visualization, and automation skills, enabling me to streamline complex processes and drive efficiency in various industries.
As a B2B specialist, I recognize the unique challenges that professionals face when managing and analyzing large volumes of data. With this understanding, I create tutorials tailored to businesses’ specific needs, offering practical solutions to enhance productivity, improve decision-making, and optimize workflows.
My tutorials cover various topics, including advanced formulas and functions, data modeling, pivot tables, macros, and data visualization techniques. I strive to explain complex concepts in a clear and accessible manner, ensuring that even those with limited Excel experience can grasp the concepts and apply them effectively in their work.
In addition to my tutorial work, I actively engage with the Excel community through workshops, webinars, and online forums. I believe in the power of knowledge sharing and collaborative learning, and I am committed to helping professionals unlock their full potential by mastering Excel.
With a strong track record of success and a growing community of satisfied learners, I continue to expand my repertoire of Excel tutorials, keeping up with the latest advancements and features in the software. I aim to empower businesses with the skills and tools they need to thrive in today’s data-driven world.
Suppose you are a B2B professional looking to enhance your Excel skills or a business seeking to improve data management practices. In that case, I invite you to join me on this journey of exploration and mastery. Let’s unlock the true potential of Excel together!
https://www.linkedin.com/in/cansuaydinim/


