
Did you ever hear about excel data analysis toolpak? Because if you work with large sets of data in Excel, then you know how important it is to analyze that data quickly and efficiently. The Analysis ToolPak is a Microsoft Excel add-in. And it gives us a set of statistical tools for analyzing data. So what is excel data analysis toolpak and the benefits of using it? The Analysis ToolPak is a Microsoft Excel add-in that provides users with statistical tools for analyzing data. This pack offers a variety of analysis options. Such as regressions and correlation analyses. You can also create scatter plots and pivot tables analysis for excel.
Table of Contents
benefits of using excel data analysis toolpak
This is a Microsoft Excel add-in that provides data analysis tools for financial, statistical and engineering data. It is an optional install with Excel tough. The benefits of using the Analysis ToolPak are listed below for advanced data people.
- You can perform complex statistical analyses. Such as forecasting and data mining.
- The toolbar contains various regression analysis tools to choose from.
- It can help you spot trends in your data set and you may not have noticed otherwise.
What Are The Benefits of Analysis ToolPak in Excel?
Time savings: how to install excel data analysis
If you are working with a large amount of data in Microsoft Excel, then you know how time-consuming to perform calculations by hand. The good news is there is a handy tool included in Excel. And it can automate many of these tasks for you. This tool is called the Analysis ToolPak and it can save you hours on complex projects.
Improved accuracy: how to include data analysis in excel
When working with data, even a one slight formula typo can mess your plans. The slightest mistake can have huge implications on budgets and costs for example. And so it is vital to get it right. Excel provides several features to help users achieve greater accuracy in their work. And we have one of which is the Analysis ToolPak. Basically, this Analysis ToolPak is a collection of statistical tools so you can perform data analysis within Excel. It includes various features such as regressions, Fourier analyses and random number generation for people in data world.
Ease of use: data analysis tool excel
Excel is an awesome tool for analyzing data and you can really boost its capabilities with the ToolPak. This add-in gives you access to a bunch of statistical and financial functions. But in normal Excel, you won’t find it in the standard version. It might take a little time to learn all the features at first. But it is super useful for anyone doing more complex analyses.
The ToolPak adds advanced statistical functions like variance analysis, correlation, frequency and sampling right into Excel. Even though it comes with most Microsoft Office installations, it isn’t available right off the bat in Excel. So, you will need to install it manually before opening it.
Step 1: analysis for excel
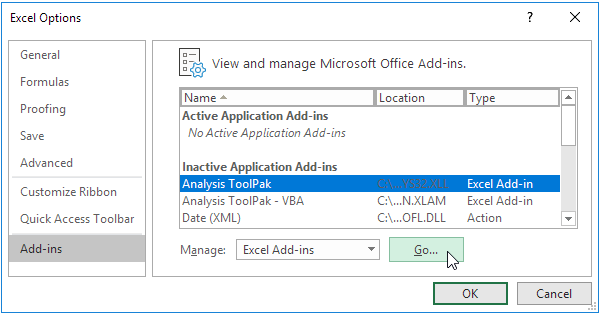
Once you downloaded this add in, you should open the worksheet you want. Or you can create a new worksheet. Then, you may click the File tab in the top menu and click Options.
Step 2
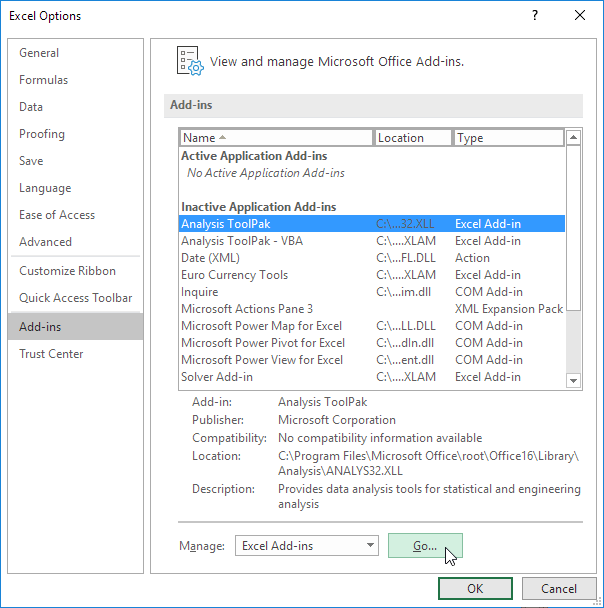
Here you should click Add-ons in the side menu of Options. Now, you can click “Go” in the Manage area at the bottom so you will open the Add-ons menu.
Stage 3
So, checking the “Analysis ToolPak” box and clicking “OK” is the first step. If it doesn’t appear in the menu, there is an option to select Browse to locate it. If a message pops up asking whether to install it, clicking Yes will move things along.
Now, clicking on Data tab reveals the Data Analysis option in the Analysis group. But here we are assuming everything was added successfully.
In summary, for anyone needing to carry out complex statistical or engineering analyses, the Analysis ToolPak can help them do formulas in clicks and save time. As a user, you will simply provide the data and parameters for each analysis.
how to add analysis toolpak in excel
The tool displays the results in an output table using the appropriate statistical or engineering macro functions. Some tools create graphs in addition to output tables.
Data analysis functions can only work at one worksheet at any given time. When you apply data analysis to grouped worksheets, the results appear on the first worksheet and blank. While formatted tables appear on the remaining worksheets. In case you wanna perform data analysis on the remaining worksheets, you should recalculate the analysis tool for each worksheet.
What Is the Covariance Tool? data analysis toolpak
The Correlation and Covariance tools can work in same setting when you have N different measurement variables in the set of individuals. The Correlation and Covariance tools will give an output table. This basically is a matrix showing the correlation coefficient or covariance between each measurement variable respectively. And it measures the correlation coefficient and covariance extended to two measurement variables that vary together.
Can Excel Analyze Data? excel data analysis tool
Analyze Data is available to Microsoft 365 subscribers in English, French, Spanish, German, Simplified Chinese and Japanese. If you are a Microsoft 365 subscriber, you should ensure you have the latest Office version. You can also overview of update channels for Microsoft 365 apps. Moreover, the Natural Language Queries feature in Analyze Data is gradually becomes available to new customers. Yet they are not available in all countries or regions at this time.

A dedicated Career Coach, Agile Trainer and certified Senior Portfolio and Project Management Professional and writer holding a bachelor’s degree in Structural Engineering and over 20 years of professional experience in Professional Development / Career Coaching, Portfolio/Program/Project Management, Construction Management, and Business Development. She is the Content Manager of ProjectCubicle.


