Covariance Matrix in Excel: How to Calculate and Use it in Data Analysis
Covariance Matrix in Excel is a statistical measurement that indicates the degree of relationship between two random variables. In data analysis, it is used to measure the degree to which two variables change together. A covariance matrix is a matrix that contains the covariances between all possible pairs of variables in a dataset. In this article, we will discuss what a covariance matrix is, how to calculate it in Excel, and how to use it in data analysis.
Table of Contents

Covariance Matrix in Excel
What is a Covariance Matrix?
A covariance matrix is a square matrix that displays the variances and covariances of all possible pairs of variables in a dataset. In other words, it is a matrix that shows how much two variables are related to each other. The diagonal of the matrix shows the variance of each variable, while the off-diagonal elements show the covariances between the pairs of variables.
Why is a Covariance Matrix important in Data Analysis?
A covariance matrix is an essential tool in data analysis because it helps in understanding the relationship between two or more variables. By examining the covariances, we can identify the direction of the relationship between the variables, whether positive or negative. Positive covariance means that the variables move in the same direction, while negative covariance means that they move in opposite directions. A high covariance means that the variables are strongly related, while a low covariance means that they are weakly related.
How to Calculate a Covariance Matrix in Excel?
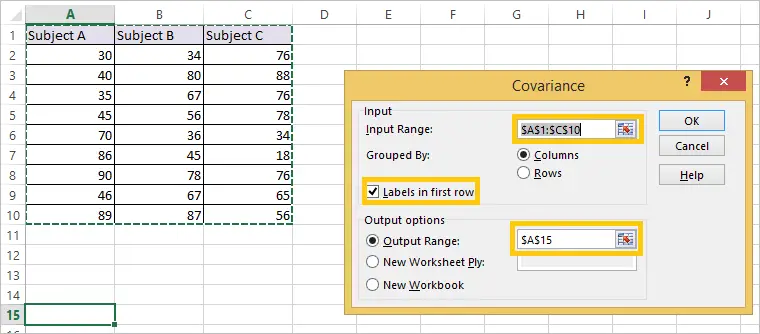
Calculating a covariance matrix in Excel is relatively easy. First, you need to arrange your data in a table with each column representing a variable. Then, follow these steps:
- Select the range of cells that contain your data.
- Click on the “Data” tab in the Excel ribbon.
- Click on the “Data Analysis” button in the Analysis group.
- Select “Covariance” from the list of analysis tools.
- Click on the “OK” button.
- In the Covariance dialog box, select the range of cells that contain your data.
- Select the “Labels in first row” option if your data has column headings.
- Select the “Output Range” option and specify the range where you want to place the covariance matrix.
- Click on the “OK” button.
Excel will then calculate the covariance matrix and display it in the output range that you specified.
How to Use a Covariance Matrix in Data Analysis?
A covariance matrix is a powerful tool in data analysis, and it can be used in various ways. Here are some common applications of covariance matrices in data analysis:
PCA
In statistics, researchers use Principal Component Analysis (PCA) to reduce the number of variables in a dataset while preserving the essential information. They achieve this by creating a new set of variables that are linear combinations of the original variables, called principal components.
PCA relies heavily on the covariance matrix as it helps compute the eigenvalues and eigenvectors of the dataset. These values and vectors help identify the principal components of the dataset.
Factor Analysis
Factor Analysis is a statistical technique that helps determine the underlying factors that account for the variance in a dataset. Researchers achieve this by creating a set of new variables, called factors, which describe the correlation between the original variables. Also, these factors are ranked such that the first factor explains the most significant amount of variance in the data, followed by the second factor, and so on.
A covariance matrix plays an essential role in factor analysis as it estimates the factor loadings, denoting the correlation between the factors and the original variables. Researchers use these loadings to identify the most significant factors that explain the variation in the data.
Portfolio Analysis
In finance, analysts use portfolio analysis to evaluate the performance of a group of investments. They achieve this by computing the covariance matrix of the individual assets’ returns in the portfolio. This matrix is then utilized to estimate the portfolio’s risk and return and to enhance the asset allocation.
Regression Analysis
When analyzing data, researchers use regression analysis to model the connection between a dependent variable and one or more independent variables. Also, by employing a covariance matrix, they can determine the standard errors of the regression coefficients, which are necessary to test the statistical importance of the regression model.
Conclusion
In conclusion, a covariance matrix is a powerful tool in data analysis that helps in understanding the relationship between two or more variables. It is used to measure the degree to which two variables change together and to identify the direction and strength of the relationship. Also, a covariance matrix is easy to calculate in Excel and can be used in various applications such as PCA, factor analysis, portfolio analysis, and regression analysis. Understanding the covariance matrix is essential for any data analyst or data scientist. We hope it helps you. You can read this article on the subject or you can read this article we found for you from another site.
FAQs
- What is the difference between covariance and correlation? Covariance measures the degree to which two variables change together, while correlation measures the strength and direction of the linear relationship between two variables.
- Can a covariance be negative? Yes, a covariance can be negative if the variables move in opposite directions.
- What is the diagonal of a covariance matrix? The diagonal of a covariance matrix shows the variance of each variable.
- How can I interpret the values in a covariance matrix? The values in a covariance matrix represent the covariances between the pairs of variables. Positive values indicate a positive relationship, negative values indicate a negative relationship, and values close to zero indicate no relationship.
Hello, I’m Cansu, a professional dedicated to creating Excel tutorials, specifically catering to the needs of B2B professionals. With a passion for data analysis and a deep understanding of Microsoft Excel, I have built a reputation for providing comprehensive and user-friendly tutorials that empower businesses to harness the full potential of this powerful software.
I have always been fascinated by the intricate world of numbers and the ability of Excel to transform raw data into meaningful insights. Throughout my career, I have honed my data manipulation, visualization, and automation skills, enabling me to streamline complex processes and drive efficiency in various industries.
As a B2B specialist, I recognize the unique challenges that professionals face when managing and analyzing large volumes of data. With this understanding, I create tutorials tailored to businesses’ specific needs, offering practical solutions to enhance productivity, improve decision-making, and optimize workflows.
My tutorials cover various topics, including advanced formulas and functions, data modeling, pivot tables, macros, and data visualization techniques. I strive to explain complex concepts in a clear and accessible manner, ensuring that even those with limited Excel experience can grasp the concepts and apply them effectively in their work.
In addition to my tutorial work, I actively engage with the Excel community through workshops, webinars, and online forums. I believe in the power of knowledge sharing and collaborative learning, and I am committed to helping professionals unlock their full potential by mastering Excel.
With a strong track record of success and a growing community of satisfied learners, I continue to expand my repertoire of Excel tutorials, keeping up with the latest advancements and features in the software. I aim to empower businesses with the skills and tools they need to thrive in today’s data-driven world.
Suppose you are a B2B professional looking to enhance your Excel skills or a business seeking to improve data management practices. In that case, I invite you to join me on this journey of exploration and mastery. Let’s unlock the true potential of Excel together!
https://www.linkedin.com/in/cansuaydinim/


