The Ultimate 2023 Guide to What Is Fault Tree Analysis And How To Perform It
Looking to understand “What Is Fault Tree Analysis And How To Perform It?” This definitive guide explores the methodology, applications, and a step-by-step guide to bulletproof your systems.
Table of Contents
fault-tree-analysis
Introduction
Welcome to the ultimate guide on understanding the ins and outs of Fault Tree Analysis (FTA). Whether you’re a business leader, a manager looking to enhance system reliability, or an engineer aiming to understand failure mechanisms, this guide will provide you with comprehensive insights. Here, we break down everything from its importance and applications across industries to the methodology and steps involved. We’ll also discuss essential tools, common pitfalls, and how to get started with FTA.
What Is Fault Tree Analysis And How To Perform It?
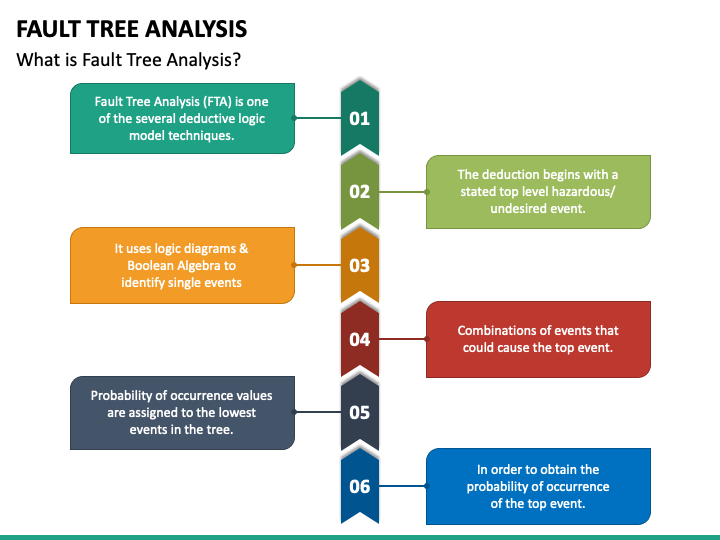
Fault Tree Analysis is a systematic, deductive approach used for analyzing undesired states of a system and identifying contributing causes and events. In essence, you start with the “fault,” or undesired outcome, and work your way backward to identify various factors that could lead to this outcome. The result is visually represented in the form of a tree diagram with the undesired event as the root, and the potential causes and events branching out like a tree.
Example: Imagine you’re analyzing the failure of an industrial boiler. The undesired event (root) would be the “boiler explosion,” and the branches might include contributing factors such as “pressure too high,” “safety valve malfunction,” or “operator error.”
Importance of Fault Tree Analysis
Why Businesses Need Fault Tree Analysis
In business settings, Fault Tree Analysis acts as a proactive tool for risk management. It helps in uncovering potential vulnerabilities in various systems, including production, safety, and software. By identifying weak links in advance, you can take corrective actions before an adverse event occurs. This is not just about solving problems; it’s about foreseeing them. For instance, a well-conducted FTA in a chemical plant could identify potential failure points in safety measures, thus preventing accidents that could save lives and millions in damages.
Applications in Different Industries
Fault Tree Analysis is highly versatile, with applications that extend across diverse domains such as:
- Manufacturing: To identify production bottlenecks or safety risks.
- Aviation: For analyzing the failure possibilities in navigation or engine systems.
- Healthcare: Used in assessing the risk factors in medical devices or hospital procedures.
- Software Development: To uncover potential bugs or vulnerabilities that could lead to software failure.
Example in Healthcare:
In healthcare, let’s say there’s a piece of critical medical equipment like a ventilator. FTA can be employed to study how and why the ventilator could fail. By doing this, you can take preventive measures to ensure that such a crucial device does not fail when a patient’s life depends on it.
fault-tree-analysis
Methodology Behind Fault Tree Analysis
The Basics: Symbols and Terminology
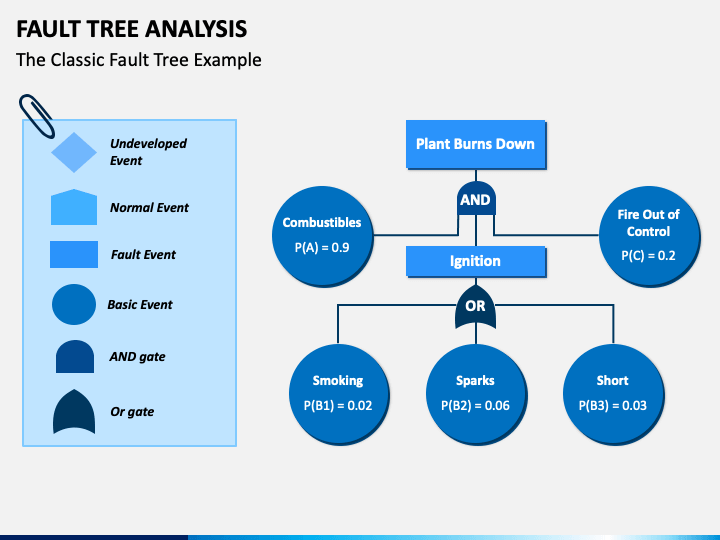
Understanding the basic symbols and terminology is crucial for effective Fault Tree Analysis. Some common symbols include:
- Rectangles: Basic Events
- Circles: Intermediate Events
- Diamonds: Undeveloped Events
- AND/OR Gates: Logical connectors
Tip: Familiarize yourself with these symbols as they form the building blocks of your fault tree. You might also encounter more specialized symbols depending on the complexity of the system you’re analyzing.
The Steps Involved
Performing a Fault Tree Analysis involves several systematic steps:
- Define the Top Event: Specify the undesired outcome that you want to analyze.
- Identify Initiating Events: Enumerate all the basic events that could contribute to the top event.
- Add Logical Gates: Employ AND, OR, and other gates to establish logical relationships between events.
- Evaluate the Tree: Carry out qualitative and quantitative analyses to derive insights.
Calculation Example: You may need to calculate the probability of the top event occurring based on the probabilities of the initiating events. If an OR gate is used, the probability of the top event is the sum of the probabilities of the initiating events.
Tools for Fault Tree Analysis
Software Tools
Several software tools are available to make your FTA process smoother, such as OpenFTA, Event Tree Analysis Software, and ReliaSoft BlockSim. These come with graphical user interfaces that allow drag-and-drop functionalities, and most importantly, they automate the intricate calculations required in quantitative analysis.
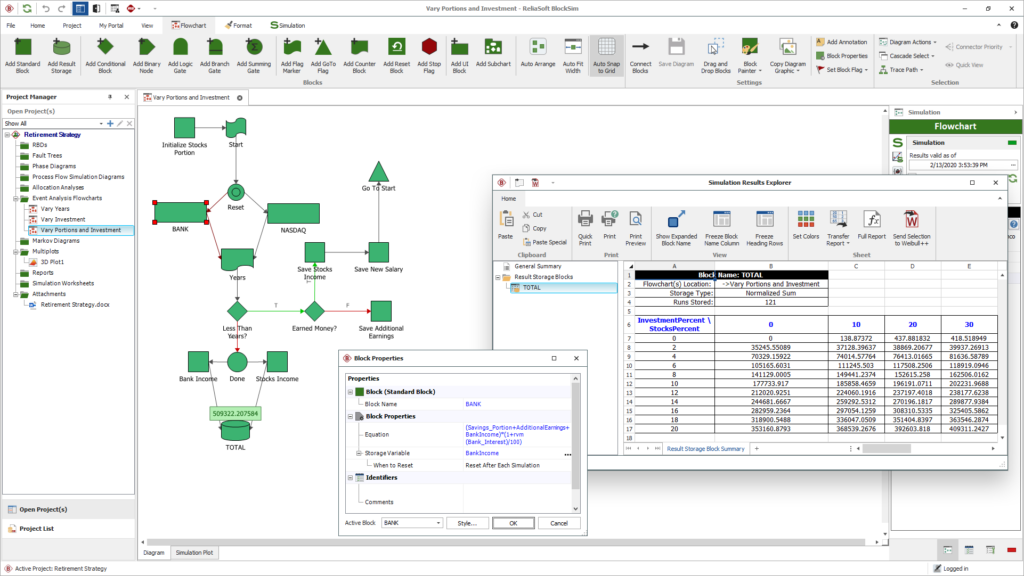
ReliaSoft BlockSim
Traditional Pen-and-Paper Method
If you’re dealing with a simpler system or are in the brainstorming stage, sketching out a fault tree on paper can be quite effective. It’s quick, and it encourages team participation.
Tip: It’s beneficial to start with a pen-and-paper approach for preliminary evaluations and then move to software tools for more detailed, quantitative analyses.
Common Pitfalls and How to Avoid Them
Ignoring Human Factors
One common mistake is focusing solely on mechanical or technical aspects, thus ignoring human factors. Ensure that your analysis takes into account human errors or decision-making lapses.
Example: If you’re analyzing a car’s braking system, consider not just mechanical failure but also the possibility of driver error.
Complexity Overload
It’s essential to be comprehensive, but adding too much detail can lead to an unwieldy, complicated fault tree that is difficult to manage and understand. Strike a balance between detail and manageability.
Tip: Use sub-trees to break down complex branches into more manageable chunks.
Working Through an Example
Selecting a Problem
Choosing the right problem to focus on is crucial. For effective FTA, you need to be specific about the undesired event you’re analyzing. It sets the scope and boundaries for your entire analysis.
Example: Instead of vaguely focusing on “aircraft failure,” specify the undesired event as “engine failure during takeoff.”
Identification of Initiating Events
Initiating events are the leaves of your fault tree. They are the smallest, most basic events that contribute to the undesired outcome.
Example: For a “data breach” as an undesired event, initiating events might include “password cracking,” “phishing attack,” and “insider threat.”
Gate Logic in Fault Tree Analysis
OR Gates
Use OR gates when any one of the contributing events is enough to cause the top event. For example, in the case of a house fire, either “electrical short-circuit” OR “gas leak” could be sufficient to trigger it.
AND Gates
AND gates are used when all the input events must occur together to result in the top event. For example, in a nuclear power plant, “coolant failure” AND “backup failure” AND “operator error” might all need to occur for a meltdown to happen.
Quantitative and Qualitative Analysis
Quantitative Metrics
In quantitative FTA, you would calculate the probabilities and frequencies of the various basic and intermediate events in order to ascertain the likelihood of the top event occurring. This often involves complex statistical models and is where software tools are especially helpful.
Qualitative Insights
Qualitative analysis, on the other hand, focuses more on the “how” and “why” rather than the numerical probabilities. It’s about understanding the relationships between events, the structure of the system, and potential failure mechanisms.
Benefits of Fault Tree Analysis
- Cost-Effective: Identifying problems early on can save you significant time and money in the long run.
- Data-Driven Decision-Making: The insights garnered from FTA enable more rational, data-backed decisions, enhancing both efficiency and effectiveness.
Limitations of Fault Tree Analysis
- Resource Intensive: It may require significant time, expertise, and computational power, especially for complex systems.
- Subjective Elements: Human errors and judgment calls add a layer of subjectivity, making the process not entirely scientific.
How to Get Started
In-House vs. Consultants
You can either develop an in-house team of experts for conducting FTA or outsource the job to specialized consultants. The choice would depend on your specific needs, available expertise, and budget constraints.
Required Skillsets
Successful Fault Tree Analysis demands a wide range of skills, including data analysis, systems engineering, and domain-specific knowledge. Continuous training and updates are crucial for staying effective.
FAQs About Fault Tree
What Is Fault Tree Analysis and Results?
Fault Tree Analysis (FTA) is a top-down, systematic approach used to identify all possible causes leading to a specific undesired event in a system. It begins by defining the “top event” or “fault”—the undesirable outcome you’re interested in—and uses logical gates like AND, OR, etc., to relate this fault to various lower-level events or conditions that could lead to it. This creates a tree-like diagram with the fault at the top and various contributing factors branching out below it.
Results:
The results of FTA are typically presented in two forms:
- Qualitative Analysis: This aspect focuses on understanding the system’s failure mechanisms, the relationships between different faults, and the sequence of events that could lead to the undesired outcome. This is mostly interpretative.
- Quantitative Analysis: This involves calculating the probability or frequency of the top event occurring based on the statistical data associated with the basic events. It gives a numerical estimate of how likely the undesirable outcome is, given specific conditions.
Difference Between Fault Tree Analysis and FMEA (Failure Modes and Effects Analysis)
Both FTA and FMEA are used for system reliability and failure analysis but they differ in methodology, focus, and application. Here are some key differences:
- Direction of Analysis:
- FTA: Top-down approach, starts with an undesired event and works backward to identify causes.
- FMEA: Bottom-up approach, starts with individual components and examines how their failure could affect the system.
- Complexity:
- FTA: Better suited for complex systems where multiple factors can contribute to a single failure mode.
- FMEA: Generally used for simpler systems with straightforward failure modes.
- Representation:
- FTA: Graphical representation in the form of a tree diagram.
- FMEA: Tabular representation usually in a spreadsheet.
- Logical Relations:
- FTA: Uses logical gates to establish relationships between events.
- FMEA: Does not use logical gates; each failure mode is considered independently.
- Quantitative Analysis:
- FTA: Can be both qualitative and quantitative.
- FMEA: Primarily qualitative, although some versions incorporate a Risk Priority Number (RPN) for quantification.
Fault Tree Analysis in Aviation
In the aviation industry, FTA is used to analyze critical systems like navigation, communication, and engine operation to ensure maximum safety and reliability. For instance, an FTA could be conducted to analyze the undesired event of “engine failure during takeoff.” The tree would branch into various factors like “fuel contamination,” “bird strike,” “mechanical failure,” and “pilot error,” among others. Each branch could further subdivide into more specific causes. Quantitative analysis could then estimate the likelihood of engine failure based on historical data and test results.
Fault Tree Analysis in Pharma
In the pharmaceutical industry, FTA can be used for various applications like quality control, compliance with regulatory standards, and ensuring the safety of drug manufacturing processes. For example, an FTA could analyze the undesired event of “contamination of a drug batch.” The tree might include branches for “human error,” “equipment failure,” “raw material contamination,” etc. By identifying all the possible causes and their likelihood, preventive measures can be implemented, thereby ensuring the safety and effectiveness of pharmaceutical products.
In summary, while the core principles of Fault Tree Analysis remain constant, its application and focus can vary widely depending on the industry. It serves as a versatile tool for risk assessment and system reliability across various sectors.
Hello, I’m Cansu, a professional dedicated to creating Excel tutorials, specifically catering to the needs of B2B professionals. With a passion for data analysis and a deep understanding of Microsoft Excel, I have built a reputation for providing comprehensive and user-friendly tutorials that empower businesses to harness the full potential of this powerful software.
I have always been fascinated by the intricate world of numbers and the ability of Excel to transform raw data into meaningful insights. Throughout my career, I have honed my data manipulation, visualization, and automation skills, enabling me to streamline complex processes and drive efficiency in various industries.
As a B2B specialist, I recognize the unique challenges that professionals face when managing and analyzing large volumes of data. With this understanding, I create tutorials tailored to businesses’ specific needs, offering practical solutions to enhance productivity, improve decision-making, and optimize workflows.
My tutorials cover various topics, including advanced formulas and functions, data modeling, pivot tables, macros, and data visualization techniques. I strive to explain complex concepts in a clear and accessible manner, ensuring that even those with limited Excel experience can grasp the concepts and apply them effectively in their work.
In addition to my tutorial work, I actively engage with the Excel community through workshops, webinars, and online forums. I believe in the power of knowledge sharing and collaborative learning, and I am committed to helping professionals unlock their full potential by mastering Excel.
With a strong track record of success and a growing community of satisfied learners, I continue to expand my repertoire of Excel tutorials, keeping up with the latest advancements and features in the software. I aim to empower businesses with the skills and tools they need to thrive in today’s data-driven world.
Suppose you are a B2B professional looking to enhance your Excel skills or a business seeking to improve data management practices. In that case, I invite you to join me on this journey of exploration and mastery. Let’s unlock the true potential of Excel together!
https://www.linkedin.com/in/cansuaydinim/


