

Earned Value Analysis (EVA) uses specific parameters that help you to measure the current performance of a project. You can determine the project’s cost and schedule over-runs at any stages with them. They evaluate how the project is performing by focusing on schedule and cost-efficiency. The Schedule Performance Index (SPI) formula divides the Earned Value (EV) by the Planned Value (PV). And the Cost Performance Index (CPI) formula divides the Earned Value (EV) by the Actual Cost (AC). These calculations are early warning signals to show how well you are proceeding compared to the planned schedule and budget. In this article, we will review the key differences between the Schedule Performance Index (SPI) and Cost Performance Index (CPI) with the help of mathematical examples.
Table of Contents
What is Schedule Performance Index (SPI)?
Project managers create schedules by using estimating tools and track the schedule’s actual status as the project progresses. Bottom-up estimating, which aims at making estimation at the lowest level of detail, is always considered to be time consuming. Therefore, project managers often look for a way to make correct schedule forecasts without making bottom-up estimates. Reviewing only planned and actual figures can provide you very limited information. That’s why they need additional indicators and formulas.
For sure, you can take a look at the Gantt Chart of your project and compare the star and finish dates of the baseline and actual bars to understand whether your project is running late. However, working with formulas provides a mathematical approach.
SPI is a measurement of the productivity of your project relying on the planned work schedule. The ratio of Earned Value (EV) to Planned Value (PV) gives SPI. It provides basic information about schedule efficiency.
Schedule Performance Index (SPI) Formula
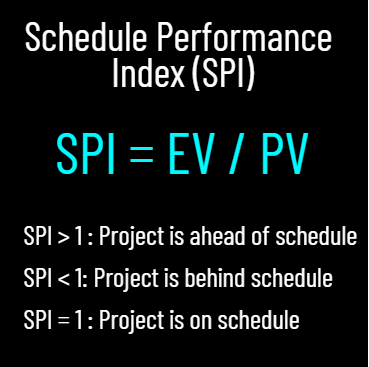
SPI = EV / PV
Once you have all the values for Earned Value (EV) and Planned Value (PV), it is easy to calculate the values for SPI at any stage of your project.
The Schedule Performance Index formula gives 3 results regarding the schedule performance.
• SPI > 1: We are ahead of schedule and we completed more than we planned.
• SPI < 1: We are behind schedule. We completed less than we planned.
• SPI =1: Our performance is on target. Work is completed as planned.
Note that while calculating the SPI of the overall work schedule, make sure that you take all the activities into consideration. Considering only the critical path activities cannot give accurate results.
Schedule Performance Index Example
We have a project to be completed in 30 months and the budgeted cost of the project 100,000,000 USD. 12 months have passed and 45,000,000 USD has been spent, but only 25% of the work has been completed
Now we will calculate the Schedule Performance Index (SPI) and Schedule Variance (SV) based on the information.
Planned Value (PV) = (12/30) x 100,000,000 USD = 40,000,000 USD
Earned Value (EV) = %25 x 100,000,000 USD = 25,000,000 USD
SPI = EV / PV
SPI = 25,000,000 / 40,000,000 = 0,625
SPI < 1; The result is less than one. So that we are behind the schedule.
SV = EV – PV
SV = 25,000,000 USD – 40,000,000 USD = – 15,000,000 USD
What is Cost Performance Index?
Cost Performance Index (CPI) is a measurement of your efficiency based on two parameters; Earned Value (EV) and Actual Costs (AC).
It is the ratio of Earned Value (EV) to Actual Costs (AC) which helps you to evaluate the cost-efficiency of your project.
The CPI calculates the value of the work completed compared to the actual cost spent.
Simply we can say that the Cost Performance Index (CPI) calculates how much we are earning for each dollar spent on the project.
Cost Performance Index Formula
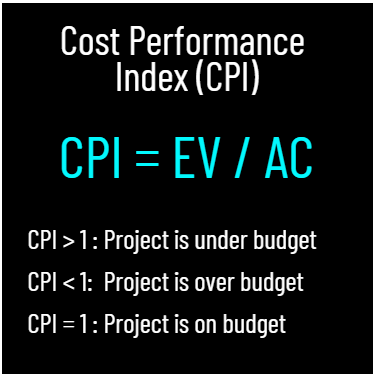
CPI = EV / AC
The Cost Performance Index formula gives 3 results;
• CPI > 1: We are under budget. We are spending less than we earn.
• CPI < 1: We are over budget. We are spending more than we earn.
• CPI =1: We are on budget. We are proceeding as planned. If we proceed with this ratio we will complete the project on time.
Cost Performance Index Example
Up to this section, we reviewed the Schedule Performance Index Formula and Example. Now we will analyze a CPI Example for better understanding.
We have a project to be completed in 30 months and the budget of the project is 100,000,000 USD. 12 months have passed and 45,000,000 USD has been spent, but only 25% of the work has been completed
Now we will calculate the CPI and Cost Variance
Cost Performance Index (CPI)
Actual Cost (AC) = 45,000,000 USD
Earned Value (EV) = %25 x 100,000,000 USD = 25,000,000 USD
CPI = EV / AC
CPI = 25,000,000 / 45,000,000 = 0,555
CPI < 1; We are over budget. This means that we are earning 0.55 USD for every 1 USD spent.
Cost Variance (CV)
CV = EV – AC
CV = 25,000,000 USD – 45,000,000 USD = – 20,000,000 USD
What is the Relationship Between SPI and CPI?
Schedule Performance Index (SPI) provides you critical information about your project’s progress. However, it provides no information about how much money has been spent to achieve the progress.
On the other hand, Cost Performance Index (CPI), provides you an estimate of the final budget depending on your current performance ratio.
These two calculations combines both schedule and cost metrics to provide you a complete view of performance.
Keystones
- A high or low value of SPI or CPI shows that your estimates are not compatible with the targets of your project. You must revise your assumptions and take corrective actions if needed.
- Both Cost Performance Index (CPI) and SPI give 3 results regarding the performance of the project.
- If the Cost Performance Index (CPI) or SPI is equal to one, this means that the project is proceeding as planned.
- Both Cost Performance Index (CPI) and Schedule Performance Index (SPI) need Earned Value (EV) to make calculations.
- Both Cost Performance Index (CPI) and Schedule Performance Index (SPI) measurements depend on the project’s past performance and they can be used to estimate future performance.
- Cost Performance Index (CPI) and Schedule Performance Index (SPI) measurements improve decision-making among the project team.
- Both SPI and CPI are functions of time. They show the trends in project performance.
Summary
The Schedule Performance Index (SPI), Cost Performance Index (CPI), Schedule Variance (SV), and Cost Variance (CV) are performance indicators used in the Earned Value Management. With the help of these tools, it is easy to understand the health or sickness of our projects. Project size, duration, and other properties do not make any difference in the calculation of these indexes. Project teams must be aware of their project’s current performance to make realistic forecasts for future performance. These metrics provide valuable information that helps to complete a project within budget and approved schedule.
Earned value (EV) measurements use indicators to analyze a project’s past performance and estimate its future performance. In this article, we review both the Schedule Performance Index and Cost Performance Index Formulas and Examples. If you are preparing to take the CAPM or PMP Certification Exam, you must know their key aspects and importance for project management.
See Also
Earned Value Management Example
External Reference

I am a Civil Engineer in HES Consultancy Limited, experience as Director and Resident of Works and Technical, Financial and Administrative Project Audit. I have skills in the area of Procurement, Tenders and Contracting. I am PMP and PRINCE2 Certified. Monitoring and Control with the Earned Value Method.


