Power BI Data Modeling: The Bedrock of Stunning Visualizations
Power BI is a game changer in data analysis, but its actual strength rests in its data model. This is more than merely entering data and hoping for the best. A well-crafted data model serves as the foundation for smart reports, clear visualizations, and a pleasant user experience. In this blog article, we’ll go over the fundamentals of Power BI data modeling, including recommended practices.
Table of Contents
What is Power BI Data Modeling?
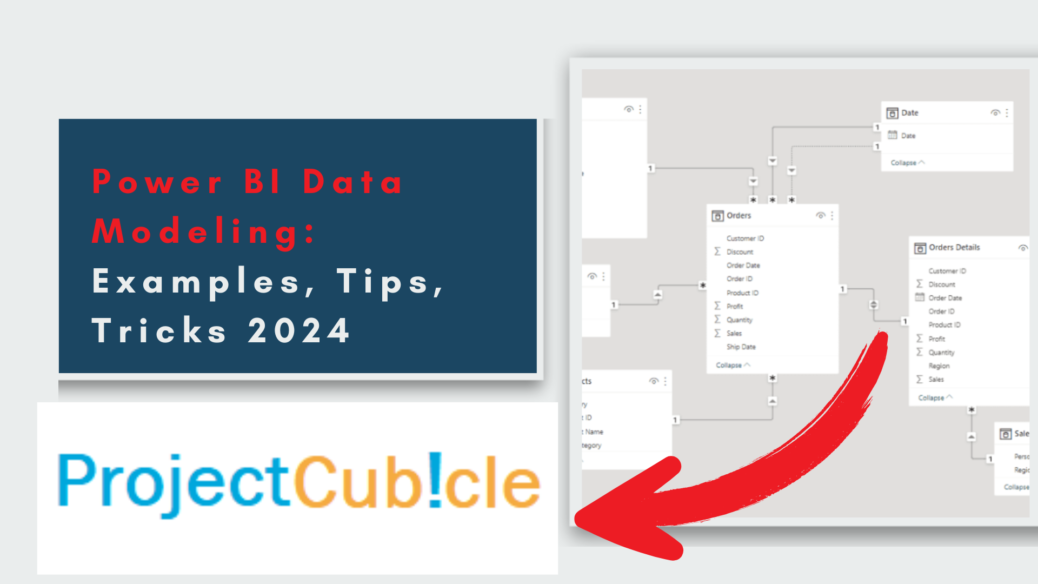
Imagine your data model as the blueprint for your Power BI report. It defines how your data is structured, connected, and transformed. It involves:
- Tables: These hold your data, categorized logically (e.g., customers, products, sales).
- Relationships: These connections between tables show how data points relate (e.g., a customer ID in the sales table links to a customer record in the customer table).
- Calculated Columns & Measures: These extend your data’s capabilities, allowing you to create custom fields and insightful calculations.
Why is Data Modeling Important?
A solid data model unlocks a treasure trove of benefits:
- Faster Performance: Clean, organized data models process information swiftly, enabling smooth report interaction.
- Accurate Analysis: Defined relationships ensure data is interpreted correctly, leading to reliable insights.
- Flexibility and Scalability: A well-structured model can handle new data sources and evolving needs easily.
- Stunning Visualizations: Clear data relationships translate into clear and compelling visualizations.
Power BI Data Modeling: A Step-by-Step Guide
Power BI data modeling is the foundation for creating insightful reports and stunning visualizations. Here’s a step-by-step guide to walk you through the process:
1. Prepare Your Data:
- Gather your data sources: Identify and connect to your data sources, which can be Excel files, databases, cloud storage services, or other connectors supported by Power BI.
- Cleanse your data: Before importing, ensure your data is clean and consistent. Remove duplicates, fix formatting inconsistencies, and handle missing values. There are data cleaning tools within Power BI or you can use Power Query Editor for advanced cleansing.
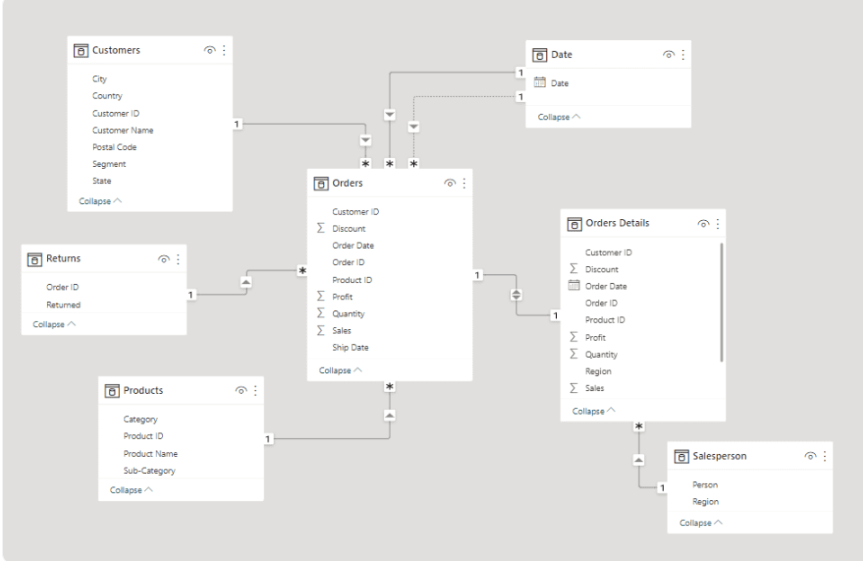
data modeling Power BI
2. Import and Transform Data:
- Import data: Import your prepared data sources into Power BI Desktop. You can choose to import entire tables or specific columns.
- Transform data (optional): Utilize Power Query Editor for data transformation tasks. Here you can filter data, rename columns, create new calculated columns, and perform data type conversions to ensure consistency.
3. Build Your Data Model:
- Define tables: Each table represents a specific category of data (e.g., customers, products, sales). Drag and drop these tables from the Fields pane onto your modeling workspace.
- Establish relationships: Create relationships between tables based on common fields. For example, a customer ID in the sales table might link to a customer ID in the customer table. These relationships show how data points are connected across tables. Use the “Modeling” tab to manage relationships.
4. Enhance Your Data (Optional):
- Calculated columns: Extend your data’s capabilities by creating calculated columns using DAX formulas. These columns can perform calculations, combine data from multiple tables, or create new categories based on existing data.
- Measures: Create measures using DAX to perform specific calculations relevant to your analysis. Unlike calculated columns, measures typically summarize data and are used in visualizations. For instance, you could create a measure to calculate total sales or average profit margin.
5. Validate and Optimize:
- Data validation: Implement data validation rules to catch errors early on and ensure the accuracy of your data model. Power BI offers tools to identify and fix data quality issues.
- Optimize performance: As your model grows complex, consider performance optimization techniques. Power BI Desktop provides tools to analyze query performance and identify bottlenecks.
6. Finalize and Document:
- Review and finalize: Carefully review your data model, ensuring relationships are accurate, calculations work as expected, and the overall structure aligns with your analysis goals.
- Document your model: Document your data model, including data sources, relationships, calculated columns, and measures. This clarifies the model for yourself and future collaborators who may need to understand or modify it.
Can you design data modeling in the Power BI service?
Absolutely! Power BI service, the web-based version of Power BI, provides all the functionalities for data modeling. You can import data from various sources, define relationships, create calculated columns and measures, and build your entire data model within the service.
Power BI Data Modeling: Examples to Brighten Your Understanding
Data modeling can sound abstract, but with examples, it becomes clear how it organizes and structures your data for powerful analysis in Power BI. Here are a few examples to illustrate key concepts:
Example 1: Sales Analysis
Imagine you’re analyzing sales data. You have three tables:
- Customers: Contains customer details like ID, name, location, etc.
- Products: Lists product information like ID, name, category, price, etc.
- Sales: Records each transaction with details like ID, customer ID, product ID, quantity sold, date, etc.
Data modeling involves defining these tables and establishing relationships. The Sales table’s customer ID links to the Customers table’s ID, and the Sales table’s product ID links to the Products table’s ID. This one-to-many relationship is ideal for dimensional modeling.
You can then create calculated columns or measures. For example, a calculated column named “Total Spent per Customer” could be created in the Sales table, referencing the quantity and price from the Sales table and the customer ID to link back to the Customers table. This allows you to easily see how much each customer spends.
Example 2: Inventory Management
Let’s say you’re managing inventory data. You have tables for:
- Products: Similar to the sales example, containing product details.
- Locations: Stores information on warehouses or stores (ID, location name, etc.)
- Inventory: Tracks product quantities at each location, with columns for product ID, location ID, and current stock level.
Here, you’d establish relationships between the tables: Products.ID links to Inventory.ProductID, and Locations.ID links to Inventory.LocationID. This allows you to analyze inventory levels across locations for each product.
You might create a measure named “Total Inventory Value” that calculates the total value of each product across all locations, considering the stock level and price from the respective tables. This provides valuable insights for inventory management decisions.
These are just basic examples. Power BI data modeling can handle complex scenarios with numerous tables and intricate relationships, allowing you to explore your data from various angles and uncover hidden patterns.
What is the best data model for Power BI?
There isn’t a one-size-fits-all “best” data model. The ideal structure depends on your specific data and how you want to analyze it. However, dimensional modeling techniques like star schemas are highly recommended for Power BI. These organize your data efficiently, making navigating and analyzing relationships easier.
Can you create models in Power BI?
Yes, creating data models is a fundamental aspect of working with Power BI. As mentioned earlier, Power BI service provides all the tools you need to build and manage your data model.
How to do data modeling?
Data modeling involves several steps:
- Understand Your Data: Before diving in, get familiar with your data sources, their content, and how they connect in the real world. This is like understanding the properties and purposes of the building materials before construction.
- Choose a Modeling Technique: Embrace dimensional modeling techniques to organize your data efficiently. Star schemas are a popular choice for Power BI.
- Define Relationships: Carefully establish clear connections between tables. This ensures data integrity and allows powerful analysis across datasets, similar to building strong support structures between different parts of your building.
- Calculated Columns & Measures: Unleash the power of DAX formulas to create custom columns and measures, tailoring your data for specific needs. These are like adding custom features and functionalities to your building.
- Data Validation: Implement data validation rules to catch errors early on and ensure data quality. Just like ensuring the building materials are up to standard.
What is Data Modeling with an Example?
Imagine you’re analyzing sales data. You might have separate tables for customers, products, and sales transactions. Data modeling involves defining these tables, establishing relationships (e.g., a customer ID in the sales table links to a customer record), and potentially creating calculated columns (e.g., total spent per customer) or measures (e.g., average sales per product category). This structured model allows you to slice and dice your data effectively, uncovering valuable insights.
By following these steps and best practices, you’ll build data models that empower you to transform data into actionable insights. Remember, a well-designed data model is the invisible hero behind every impactful Power BI visualization.
Building a Rock-Solid Data Model
Here’s your roadmap to crafting a data model that shines:
- Understand Your Data: Before diving in, get a firm grasp of your data sources, their content, and how they connect in the real world.
- Dimensional Modeling: Embrace dimensional modeling techniques like star schemas to organize your data efficiently.
- Define Relationships: Carefully establish relationships between tables, ensuring data integrity and enabling powerful analysis across datasets.
- Calculated Columns & Measures: Unleash the power of DAX formulas to create custom columns and measures, tailoring your data for specific needs.
- Data Validation: Implement data validation rules to catch errors early on and ensure data quality.
Beyond the Basics: Power BI Data Modeling Best Practices
- Leverage Hierarchies: Create hierarchies within your data (e.g., product categories, geographic regions) for advanced drill-down capabilities.
- Optimize Cardinalities: Maintain a healthy balance between the number of rows in connected tables to avoid performance bottlenecks.
- Filter Context: Control how filters applied in one visualization affect others, ensuring a cohesive user experience.
- Model Documentation: Document your data model for future reference and collaboration, making it easier for others to understand and maintain.
Conclusion
Power BI data modeling empowers you to transform data into actionable insights. By following these guidelines and best practices, you’ll build data models that fuel impressive reports, drive data-driven decisions, and leave your audience speechless. Remember, a well-designed data model is the invisible hero behind every impactful Power BI visualization.
Ready to take your Power BI game to the next level? Explore Microsoft’s documentation and online resources for deeper dives into data modeling techniques and best practices. Happy modeling!
Hello, I’m Cansu, a professional dedicated to creating Excel tutorials, specifically catering to the needs of B2B professionals. With a passion for data analysis and a deep understanding of Microsoft Excel, I have built a reputation for providing comprehensive and user-friendly tutorials that empower businesses to harness the full potential of this powerful software.
I have always been fascinated by the intricate world of numbers and the ability of Excel to transform raw data into meaningful insights. Throughout my career, I have honed my data manipulation, visualization, and automation skills, enabling me to streamline complex processes and drive efficiency in various industries.
As a B2B specialist, I recognize the unique challenges that professionals face when managing and analyzing large volumes of data. With this understanding, I create tutorials tailored to businesses’ specific needs, offering practical solutions to enhance productivity, improve decision-making, and optimize workflows.
My tutorials cover various topics, including advanced formulas and functions, data modeling, pivot tables, macros, and data visualization techniques. I strive to explain complex concepts in a clear and accessible manner, ensuring that even those with limited Excel experience can grasp the concepts and apply them effectively in their work.
In addition to my tutorial work, I actively engage with the Excel community through workshops, webinars, and online forums. I believe in the power of knowledge sharing and collaborative learning, and I am committed to helping professionals unlock their full potential by mastering Excel.
With a strong track record of success and a growing community of satisfied learners, I continue to expand my repertoire of Excel tutorials, keeping up with the latest advancements and features in the software. I aim to empower businesses with the skills and tools they need to thrive in today’s data-driven world.
Suppose you are a B2B professional looking to enhance your Excel skills or a business seeking to improve data management practices. In that case, I invite you to join me on this journey of exploration and mastery. Let’s unlock the true potential of Excel together!
https://www.linkedin.com/in/cansuaydinim/

