Monte Carlo Simulation Example and Solution
The Monte Carlo Simulation is a quantitative risk analysis technique which is used to understand the impact of risk and uncertainty in project management. It is used to model the probability of various outcomes in a project (or process) that cannot easily be estimated because of the intervention of random variables. It can be used to overcome a range of problems in almost every field. In this article, we will analyze a Monte Carlo Simulation Example to help you to apply this method in your business field.
Table of Contents
Monte Carlo Simulation Explained
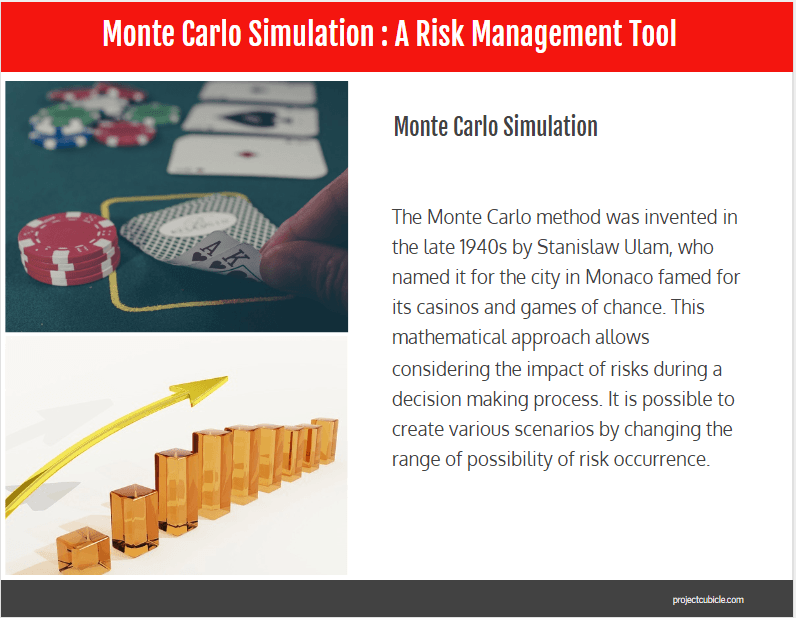
The Monte Carlo method was invented in the late 1940s by Stanislaw Ulam, who named it for the city in Monaco famed for its casinos and games of chance. This mathematical approach allows considering the impact of risks during a decision making process. It is possible to create various scenarios by changing the range of possibility of risk occurrence.
Although the Monte Carlo Simulation is a commonly used technique in risk management, many practitioners are not aware of its importance. Most of the PMP aspirants find this concept very difficult to understand. Therefore they think that using computer software is a must to perform the Monte Carlo Simulation. This method is commonly used to tackle a wide range of problems by practitioners in many fields such as finance, engineering, energy, project management, manufacturing, research and development, insurance, transportation, and the environment
You can perform the Monte Carlo Simulation for schedule and cost estimates which involve various risks. This method’s main idea is to understand the behavior of a complicated system or process by using random inputs or parameters.
Monte Carlo Simulation Example
For better understanding, let’s analyze the example below.
Assume that you are creating a work schedule for a research and development project. You noticed that there is some degree of uncertainty exists in the activity duration estimates. Then you decided to use the Monte Carlo Simulation to analyze the impact of risks that will affect your project.
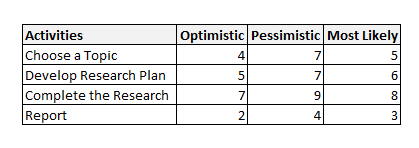
First, you create the work schedule and estimate the duration of each activity by using the three-point estimating technique. You estimate optimistic, pessimistic and most likely durations for each activity as shown in the below table.
Then you calculate the duration of each activity by using PERT Formula
PERT Estimate = ( Optimistic Estimate+ 4 x Most likely Estimate + Pessimistic Estimate) / 6
After calculating the duration of each activity, the table becomes as follows
Total Completion Time of the project is = 5,2 +6 + 8 + 3 = 22,2 Months.
For the best case, completion time of the project is ;
Total Completion Time = 4 +5 + 7 + 2 = 18 Months.
For the worst case, completion time of the project is ;
Total Completion Time = 7 +7 + 9 + 4 = 27 Months.
Now you run the Monte Carlo Simulation by using Excel or software and get the chances of completion of the project.
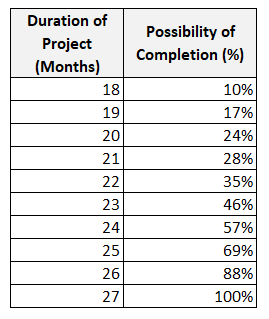
Let’s assume that you get the results after performing the Monte Carlo Simulation. Below table shows the results.
Note that these results are only for illustration. They are not from an actual simulation.
If you analyze the results, you will see that the possibility of completion of the project in the best case is the lowest and in the worst case, it is highest.
As it is seen from the table, this simulation provides you a number of results to improve your decision making.
Most business situations such as uncertainty in market demand, unknown quantity of sales, variable costs and many others are too complex for an analytical solution. But The Monte Carlo Simulation enables you to evaluate your plan numerically, you can change numbers, ask ‘what if’ and see the results.
Benefits and Limitations of Monte Carlo Simulation
Limitations
This method has some limitations. Some of these limitations are as follows:
- It is a time consuming and complicated method.
- It is not an easy method for quantitative risk analysis. You need software to run this method.
- There should be enough samples or inputs to ensure realistic results.
- Results can be effected from the implementors bias.
- Correct analysis and results depend on the quality of the estimates.
- The is tool provides a number of results based on the probabilities. It does not give the actual result.
Benefits
This method has many benefits in project risk management, such as:
- It enables to make realistic forecasts or manage activities that involve uncertainty.
- It enables to get accurate results by exploring thousands of combinations with “what-if” analysis.
- In this simulation, it’s possible to model interdependent relationships between input variables.
- It helps to improve the quality of decisions.
- It helps to make forecasts for budget, schedule, and other important project work.
- This tool provides graphical and visual data. This helps to improve communication among project team and stakeholders.
- This tool shows the inputs which have the biggest effect on the result.
Summary
Monte Carlo simulation is an efficient computer-based mathematical technique which enables people to account for variability in their process to improve decision making. Although a number of practitioners find it difficult to use, it provides many benefits to an organization. It is not used often in small and medium-sized projects. If you need effective forecasts for your business, Monte Carlo Simulation is for you. In this article, we analyzed a Monte Carlo Simulation Example. We hope that it will be useful for professionals working in the field of project management. Note that this is an important concept for the PMP Certification exam.
See Also
Decision Tree Analysis Technique

Francois Simosa is the head of training for the Gragados Training Associates, which provides special project management and risk management training programs.










Getting a certificate can boost your profession.
Your simulation should show a histogram bell curve, it is not showing that. so your example simulation results are wrong.