Power BI Tutorial: How to Perform VLOOKUP in Power BI
How to perform VLOOKUP in Power BI? VLOOKUP is a widely recognized function in Excel, known for its ability to search for a value in the first column of a range and return a value in the same row from a specified column. When it comes to Power BI, a direct VLOOKUP function doesn’t exist. However, the functionality can be replicated and even enhanced using Power BI’s robust features like DAX LOOKUPVALUE example and transformations in the Query Editor. This article delves into how to perform Power BI VLOOKUP from another table and explores the Power BI RELATED function, offering insights into the seamless integration of data analysis within your business intelligence environment.
Table of Contents
VLOOKUP stands as a cornerstone for many Excel users, offering the means to search through columns for matching data and return corresponding values. Transitioning to Power BI, one might wonder how to replicate such a familiar and essential function. Fear not, for Power BI encompasses tools and functions, notably through DAX’s LOOKUPVALUE and the Query Editor’s transformation capabilities, which not only replicate but enhance the VLOOKUP experience. This guide will walk you through performing Power BI VLOOKUP from another table, utilizing the Power BI RELATED function, and integrating sophisticated data analysis into your business intelligence workflows.
Benefits of VLOOKUP-like Features in Power BI and How to Use Them
Power BI transforms the way data analysts perform lookups and retrieve information across varied data sources. By leveraging Power BI’s advanced data modeling and DAX functions, users can achieve and surpass the traditional capabilities of Excel’s VLOOKUP function. This guide explores the benefits of using VLOOKUP-like features in Power BI and provides a detailed walkthrough on how to effectively utilize these powerful tools.
Step 4
Benefits of Using VLOOKUP-like Features in Power BI
- Enhanced Data Modeling: Power BI’s data modeling capabilities allow for the creation of complex relationships between different data tables, offering a robust foundation for lookups and data analysis.
- Advanced Lookup Capabilities: With DAX functions such as LOOKUPVALUE and RELATED, Power BI provides more flexible and powerful lookup options than Excel’s VLOOKUP, including the ability to use multiple criteria for lookups.
- Improved Data Integrity: By utilizing Power BI’s relational data model, lookups are inherently more accurate, reducing the risk of errors that can occur with manual VLOOKUP operations in Excel.
- Increased Efficiency: Power BI automates the process of finding and retrieving data across tables, significantly speeding up data analysis tasks and reducing manual effort.
- Greater Scalability: Power BI is designed to handle large datasets efficiently, making it an ideal tool for performing lookups on big data, where Excel might struggle with performance issues.
Step 5
How to Use VLOOKUP-like Features in Power BI
Power BI VLOOKUP from Another Table
- Establish Relationships: First, ensure that there is a relationship between the tables you wish to lookup data from. This can be done in the “Model” view by dragging a line between the related fields in the two tables.
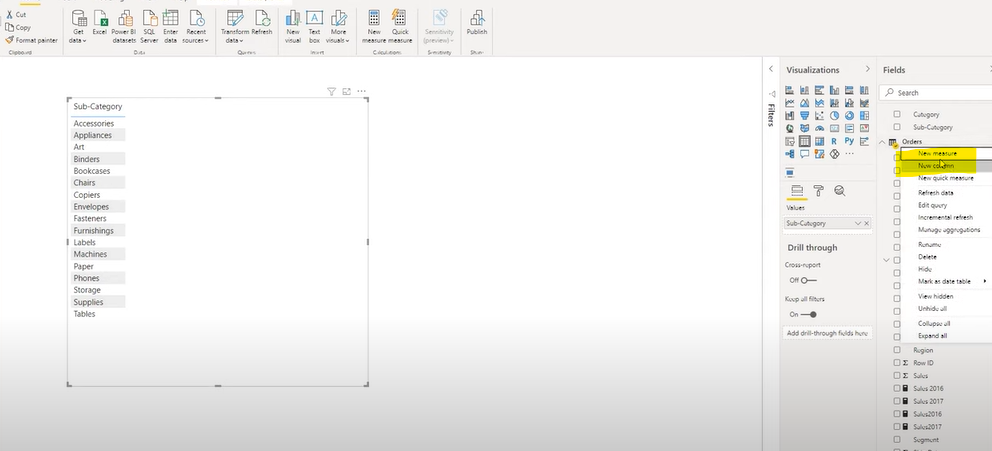
- Use DAX Functions: In a new column or measure, use the RELATED function to pull data from a related table. If there’s no direct relationship, consider using LOOKUPVALUE to perform the lookup based on specific criteria.
The Ultimate Guide to a Power BI Career: How to Learn Power BI? – projectcubicle
Vlookup in Query Editor Power BI
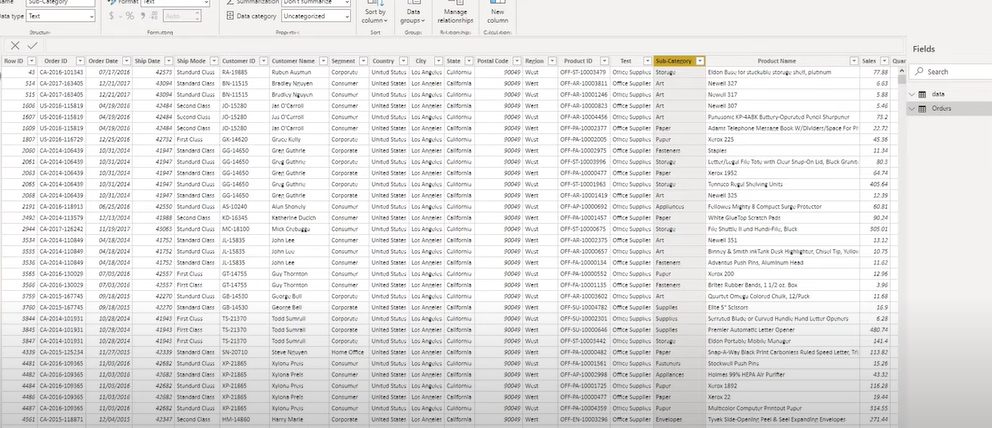
- Merge Queries: Access the Query Editor, select the primary table, and then choose “Merge Queries” from the Home tab. Select the table you want to merge with and specify the matching columns to perform the lookup.
- Expand the Merged Column: After merging, expand the merged column to include the specific columns you need from the secondary table, effectively replicating the VLOOKUP functionality.

Mindmap, DAX LOOKUPVALUE etc…
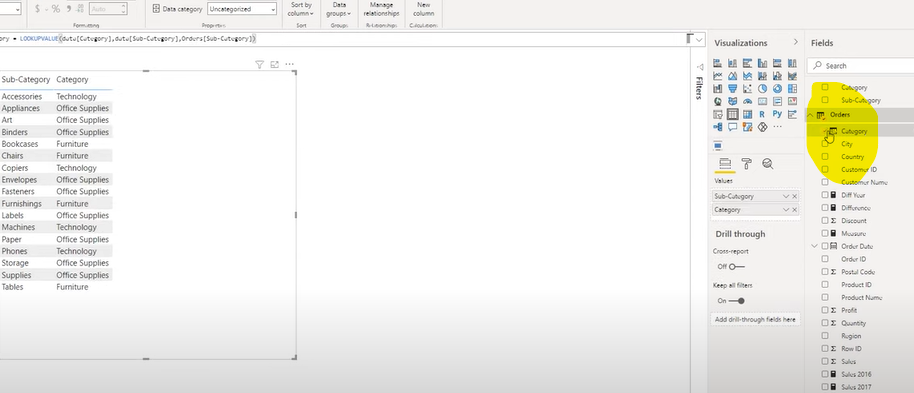
Using the DAX LOOKUPVALUE Example
- Syntax: Familiarize yourself with the LOOKUPVALUE syntax:
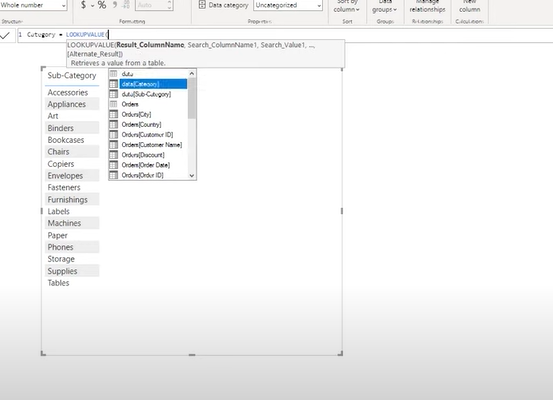
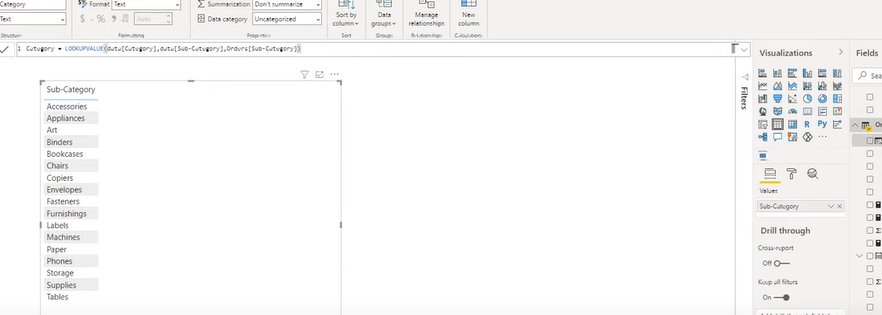
LOOKUPVALUE(result_column, search_column, search_value, [default_value]). - Apply the Function: Create a new column in your table where you want the lookup result to appear. Use the LOOKUPVALUE function to specify which value you want to find and from which column, based on a matching value in another column.
Leveraging the Power BI RELATED Function
- Create a Relationship: Ensure that there is a direct relationship between the tables you’re working with. This is a prerequisite for using the RELATED function.
- Implement RELATED: In a new column within a table, use the RELATED function to pull in values from a column in a related table. This is particularly useful for fetching related information that’s stored in separate tables within your data model.
Vlookup in Query Editor Power BI: Simplifying Data Transformation
The Query Editor in Power BI is a powerful tool for data transformation and cleaning. Although it doesn’t have a direct VLOOKUP function, it offers a suite of features to merge tables effectively. This process is akin to performing a VLOOKUP by matching values from one table to another, allowing users to bring in additional columns of data based on a common key.
- Merging Queries as a VLOOKUP Alternative: In the Query Editor, you can use the “Merge Queries” option to combine data from two tables based on a common column. This operation is similar to VLOOKUP, where you specify the primary table and the table you want to look up values from. The outcome is a combined table with matched records, enabling you to expand the table to include the columns you need.
- Custom Column Creation: For more complex scenarios, you might create a custom column that performs a lookup by using Power Query M language. This approach offers flexibility but requires a deeper understanding of the syntax and functions available in Power Query.
Enhancing Lookup Capabilities: DAX LOOKUPVALUE Example
DAX (Data Analysis Expressions) is a collection of functions, operators, and constants that can be used in a formula or expression to calculate and return one or more values. DAX LOOKUPVALUE is particularly useful for finding specific information in your data model.
- Syntax and Application: The LOOKUPVALUE function syntax is
LOOKUPVALUE(result_column, search_column, search_value[, search_column2, search_value2, …]). It searches for thesearch_valuein thesearch_columnto return the result from theresult_column. This functionality mirrors VLOOKUP, providing a powerful tool for retrieving information across different tables that are not directly related. - Advanced Use Cases: LOOKUPVALUE can be used in various scenarios, from simple lookups to more complex data analysis tasks. For instance, it can retrieve product details based on a product ID or sales information for a specific region. The function shines in scenarios where relationships between tables are not straightforward or when dealing with multiple conditions.
Power BI RELATED Function: Streamlining Data Relationships
The RELATED function in Power BI is another crucial tool for data analysis, especially when working with related tables in a data model. It allows you to fetch a related value from another table, assuming a relationship already exists between the tables.
- Usage in Calculated Columns: The RELATED function is commonly used in calculated columns to bring additional details from a related table into your current table’s context. This method is particularly useful for denormalizing your data model or simplifying access to related information without complex formulas.
Conclusion: Embracing the Power of Lookups in Power BI
Hello, I’m Cansu, a professional dedicated to creating Excel tutorials, specifically catering to the needs of B2B professionals. With a passion for data analysis and a deep understanding of Microsoft Excel, I have built a reputation for providing comprehensive and user-friendly tutorials that empower businesses to harness the full potential of this powerful software.
I have always been fascinated by the intricate world of numbers and the ability of Excel to transform raw data into meaningful insights. Throughout my career, I have honed my data manipulation, visualization, and automation skills, enabling me to streamline complex processes and drive efficiency in various industries.
As a B2B specialist, I recognize the unique challenges that professionals face when managing and analyzing large volumes of data. With this understanding, I create tutorials tailored to businesses’ specific needs, offering practical solutions to enhance productivity, improve decision-making, and optimize workflows.
My tutorials cover various topics, including advanced formulas and functions, data modeling, pivot tables, macros, and data visualization techniques. I strive to explain complex concepts in a clear and accessible manner, ensuring that even those with limited Excel experience can grasp the concepts and apply them effectively in their work.
In addition to my tutorial work, I actively engage with the Excel community through workshops, webinars, and online forums. I believe in the power of knowledge sharing and collaborative learning, and I am committed to helping professionals unlock their full potential by mastering Excel.
With a strong track record of success and a growing community of satisfied learners, I continue to expand my repertoire of Excel tutorials, keeping up with the latest advancements and features in the software. I aim to empower businesses with the skills and tools they need to thrive in today’s data-driven world.
Suppose you are a B2B professional looking to enhance your Excel skills or a business seeking to improve data management practices. In that case, I invite you to join me on this journey of exploration and mastery. Let’s unlock the true potential of Excel together!
https://www.linkedin.com/in/cansuaydinim/


