

Introduction
Welcome aboard, aspiring Basic Statistics Concepts for Data Scientists! If you’re venturing into the intriguing world of data, you’ll quickly realize that statistics are your compass. This guide aims to arm you with essential basic statistics concepts crucial for any data scientist.
Table of Contents
Why Statistics Matter in Data Science
Backbone of Decision Making
In any organization, from tech giants like Google to small startups, statistics play a pivotal role. Whether it’s market research, quality testing, or decision-making, statistical methods offer a structured approach to making informed decisions. For example, imagine a new feature for a mobile app. By conducting A/B testing, a statistical method, you can determine whether the new feature leads to a significant increase in user engagement.
Importance in Data Interpretation and Storytelling
In today’s data-centric world, collecting data is the easy part. The real skill lies in data interpretation and storytelling, turning those raw numbers into actionable insights. And for that, you need statistics. For instance, when presenting sales data to a team, using descriptive statistics can help you highlight the best-selling products (mode) and provide a clear average revenue (mean) to showcase the performance.
Types of Data in Statistics
Qualitative Data
Also known as categorical data, Qualitative Data are non-numerical and can be divided into categories like ‘yes’ or ‘no’. For instance, survey responses like “satisfied” or “unsatisfied” fall into this category.
Quantitative Data
This is numerical data that can be measured. Quantitative Data can further be divided into discrete and continuous data, helping you identify trends or patterns. For example, the heights of individuals are quantitative continuous data, while the number of cars passing by a toll booth in a given time is quantitative discrete data.
Key Basic Statistics Concepts
Descriptive Statistics

Mean, Median, Mode
The Mean gives you an average, ideal for normally distributed data. For instance, calculating the mean income of a population can provide insight into the overall economic situation.
Example: Suppose we have the incomes of five individuals: $30,000, $40,000, $50,000, $60,000, and $1,000,000. To calculate the mean income: Mean = (30,000 + 40,000 + 50,000 + 60,000 + 1,000,000) / 5 = $228,000
The Median offers the mid-point, which is resistant to outliers. This is useful when dealing with skewed data, like household income, where a few extremely high values can distort the mean.
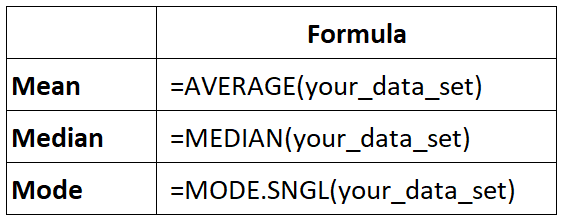
Example: In the same income dataset, the median would be the middle value, which is $50,000.
The Mode tells you which value appears most frequently in a data set.
Example: If we have the ages of a group of people: 25, 30, 25, 40, 35, 25, the mode would be 25, as it appears most frequently.
Variance and Standard Deviation

These two metrics tell you about the spread of your data. Variance helps to understand how data points vary from the average.
Example: Let’s consider a dataset of exam scores: 80, 85, 90, 70, 95. To calculate the variance:
- Calculate the mean: (80 + 85 + 90 + 70 + 95) / 5 = 84
- Calculate the squared differences from the mean: (80-84)^2, (85-84)^2, (90-84)^2, (70-84)^2, (95-84)^2
- Calculate the average of the squared differences: (16 + 1 + 36 + 196 + 121) / 5 = 74.8
The Standard Deviation helps quantify the amount of variation in a set of data points. It’s the square root of the variance.
Example: The standard deviation of the exam scores would be the square root of the calculated variance, which is approximately 8.65.
Inferential Statistics
Hypothesis Testing
This is used to make inferences or generalizations about a population based on a sample. For example, if a pharmaceutical company wants to test a new drug’s effectiveness, they might conduct a hypothesis test to determine if the drug has a significant impact compared to a placebo.
Example: Imagine a study where you want to determine if a new weight loss drug is effective. You would have two groups: one taking the drug and one taking a placebo. By comparing the weight loss in both groups, you can test whether the drug has a significant effect.
Regression Analysis
If you want to understand how one variable affects another, you need Regression Analysis. It helps to predict outcomes and understand the relationships among variables.
Example: Consider predicting house prices based on features like square footage, number of bedrooms, and location. Regression analysis can help you understand how each feature contributes to the overall price and create a predictive model.
Probability in Statistics
Why Probability Matters
Probability offers the backbone for inferential statistics. It helps you to make predictions and assess the likelihood of different outcomes.
Example: In a deck of playing cards, the probability of drawing a spade on the first draw is 13/52, as there are 13 spades out of 52 cards.
Common Probability Distributions
Some commonly used distributions include Normal Distribution, Binomial Distribution, and Poisson Distribution. The Normal Distribution is often seen in natural phenomena like height distributions, where most people are of average height and fewer people are extremely tall or short.
Example: The height of adult humans often follows a normal distribution, where the majority of people are of average height, and very tall or very short individuals are rare.
How to Apply These Concepts
Using Python Libraries
NumPy and Pandas
These libraries offer a strong foundation for data manipulation. NumPy offers excellent support for numerical computations, while Pandas is perfect for data preparation.
Example: Using NumPy, you can easily calculate the mean, median, and standard deviation of a dataset. Using Pandas, you can load, clean, and explore a dataset with ease.
Scikit-Learn
This library is your one-stop solution for all things machine learning. Also, Scikit-Learn simplifies complex algorithms and statistical models into easy-to-use functions.
Example: You can use Scikit-Learn to split a dataset into training and testing sets, train a linear regression model, and then use that model to predict future outcomes.
Real-world Applications of Statistics in Data Science
Healthcare
In healthcare, Basic Statistics Concepts for Data Scientists use statistical models to predict patient admissions and understand disease patterns. For example, predicting the likelihood of disease outbreaks based on historical data can help allocate medical resources effectively.
Example: Predicting the spread of a contagious disease based on factors like population density, travel patterns, and vaccination rates.
Marketing
In marketing, statistics help to segment customers, optimize pricing strategies, and improve customer satisfaction. Also, by analyzing customer demographics and purchasing behaviors, marketers can tailor their strategies to different customer segments, maximizing sales.
Example: Analyzing customer data to identify which age groups are more likely to purchase a certain product, leading to targeted advertising campaigns.
Tips, Tricks, and Examples
Data Visualization
Always visualize your data to understand its structure. Also, creating histograms, scatter plots, and box plots can reveal patterns and outliers.
Example: Creating a histogram of student test scores to see the distribution of scores and identify potential outliers.
Correlation vs Causation
Remember, correlation does not imply causation. Just because two variables are related doesn’t mean one causes the other.
Example: There might be a strong correlation between ice cream sales and drowning incidents in the summer, but that doesn’t mean eating ice cream causes drownings.
Importance of Outliers
Never ignore outliers; they often contain valuable information. Also, outliers could indicate errors in data collection or uncover unique insights.
Example: In a study on income distribution, an outlier might represent a highly successful entrepreneur whose income is much higher than the average, providing insights into income inequality.
Conclusion
Statistics isn’t merely a subject you need to pass in college; it’s a critical tool in your data science toolbox. Mastering these basic statistical concepts will not only help you interpret data effectively but also turn you into an asset in any data-driven organization. Whether you’re making informed decisions, building predictive models, or uncovering hidden insights, statistics will be your guiding light in the vast landscape of data science.

A dedicated Career Coach, Agile Trainer and certified Senior Portfolio and Project Management Professional and writer holding a bachelor’s degree in Structural Engineering and over 20 years of professional experience in Professional Development / Career Coaching, Portfolio/Program/Project Management, Construction Management, and Business Development. She is the Content Manager of ProjectCubicle.


