Excel Function And Formulas: The Complete Guide To Data Analysis
Microsoft Office’s Excel facilitates data processing and visualization with calculators, graphing tools, pivot tables, and Visual Basic. Excel’s speed, precision, and adaptability make it popular in business. Data analysis and manipulating data can be a daunting task for the uninitiated, but Excel function simplifies the process with its versatile set of functions and formulas.
Table of Contents
Whether you’re sorting, filtering, or formatting your data – Excel has a function or formula to do the job. Each function or formula performs a specific task, so customizing data can be achieved with relative ease.
Learning the different types of functions and formulas, such as IF, VLOOKUP, and SUM, can vastly improve your data analysis capabilities.
With a bit of practice, most data tasks become easier over time. Excel functions and formulas are the keys to unlocking the power of your data.
What Is Excel Formula and Excel Function?
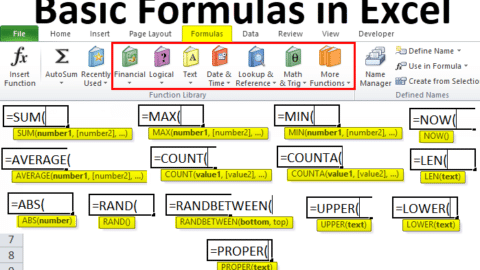
A formula is an expression that manipulates the data in several cells at once in Microsoft Excel. No matter how many times you mess up using these Excel formulas, you will always get the same answer.
Excel formulae may add, subtract, multiply, and divide. Excel lets you change date and time variables, calculate averages and percentages across columns, and more.
What Exactly Is Excel Data Analysis Using Excel Function?
Excel data analysis cleans, processes, and analyzes raw data to assist business decisions. It focuses on translating unprocessed data into meaningful metrics, findings, and interpretations. A proper Excel course teaches consumers how to reduce decision-making risks by seeing charts, photos, tables, and graphs. Businesses need data analysis to enhance procedures, profitability, and customer happiness. That’s why having Excel training courses is always going to be imperative for professionals.
Excel’s built-in pivot tables are the most often used analytical tool, making it one of the most popular data analysis programs. Some tasks in data analysis might be complex, but Excel’s built-in features make them easy and accessible. For these reasons, many businesses rely on Excel training for statistical analysis:
- Excel’s data-processing features make it possible to swiftly and accurately analyze massive datasets.
- It is quick, easy, and accurate.
- There are several methods available for examining and assessing data.
- Several different types of data entry are possible.
- It allows for several conversions and storage formats for data.

An Introduction to Data Analysis Using Excel Function
1. Identify the Information Needs
Finding out what information is required is fundamental to fruitful data analysis. Age, gender, and socioeconomic status, for instance, might be significant in population data. You may collect either numerical or categorized data.
2. Start Collecting Information Right Away via Excel Function
Data-gathering is crucial to making reliable data-driven decisions. Excel can import data from web pages, Microsoft Access databases, SQL servers, CSV, txt, and XML files.
3. Perform Data Cleansing Before Excel Function Operates
Even if you manage to arrange your data, it may still need critical information or include errors or duplicates. Correcting these mistakes is what data cleaning is all about.
In this step, flawed data is examined for errors, missing data is filled in, and mistakes are corrected. These Excel methods can help you clean your data:
- Getting rid of duplicates
Some records may be recorded twice when dealing with large volumes of information. Eliminating duplicates in a table is a built-in feature of Excel.
- Getting rid of blanks
Excel’s sorting, filtering, and searching may surprise you if your data has leading, trailing, or many hidden spaces. Using Excel’s “Trim” tool, you may remove all spaces from a text other than those used to separate words.
- Column merging and separating
It is usual practice to merge several columns into one or divide a single column into two or more in an Excel sheet. The application lets you separate street, city, province, and postal code into columns.
- Complementing or combining
Excel can assist in detecting and correcting matching errors when merging two or more tables. Its “VLOOKUP” feature, for instance, may be used to see all rows in both tables or to compare them and find ones that don’t match.
4. Explore the Data
With Excel courses, you can learn using Excel’s “Pivot Table” data analysis tool to explore your data. A “Pivot Table” summarizes data so that you can easily make calculations based on a specific criterion of your choosing.
5. Produce a Graphical Representation of Your Data
To “visualize” data is to convey it graphically or pictorially. During this stage, it is crucial to graphically show analytics so stakeholders can quickly and easily understand them.
Data Analysis Fundamentals in Excel Function
1. IF
Microsoft Excel is a powerful tool for data analysis and manipulation. Through the use of IF statements, Excel can help to analyse complex data sets with ease.
An IF statement works by defining a condition and returning a result based on that condition – either true or false. If the condition is true, the value or another operation is returned; if it is false, nothing is returned.
As a fundamental part of data analysis in Excel, the IF statement has been used in countless applications and helps make processing large volumes of data quick, efficient and accurate..
2. SUMIFS
SUMIFS is a powerful Excel tool which can be learned through excel online. A total is calculated for values that fulfill certain conditions. Another Excel function, SUMIF, does the same job as SUMIFS, except it can only test for a single state.
As a result, SUMIFS is preferable to SUMIF and may need to be addressed. The function inputs the summation range, individual range tests, and the criteria for those tests.
3. CONCATENATE
Concatenation is an essential data analysis fundamental used in Microsoft Excel. It is a process of combining multiple pieces of data or text into one cell, allowing you to quickly analyse large volumes of data.
For example, if you have a list of product IDs, you can use concatenation to combine them into one cell, making it easier to search for a specific product.
With concatenation, you can create the perfect report for an email newsletter, compile customer data from multiple columns, or combine data from multiple sources into a single output.
With a few quick steps, concatenation can streamline and simplify any data analysis project in Excel.
4. NETWORKDAYS
Using this feature, you may disregard non-workdays such as weekends and holidays. It’s a standard method in the business world for determining pay based on hours put in.
5. FIND/SEARCH
The function here shows where a selected text appears within a larger body of text. In contrast to the search feature, the find feature requires strict case-matching or returns an error.
6. IFERROR
It helps to accurately identify and evaluate errors in data sets and can make data analysis quicker and more efficient.
This function enables users to select a value if a formula evaluates to one, or if it contains an error, then specify a suitable alternative value. This can be used to gauge the accuracy of data, returning an appropriate message when an error is present.
IFERROR is easy to use and can make all the difference when dealing with large amounts of data, making Excel analysis much more effective.
7. COUNTIFS
Data analysis in Excel is only complete with the use of the COUNTIFS function. Similar to the SUMIFS process. The AVERAGEIFS, MAXIFS, and MINIFS functions are also available in Excel. However, they are not included in the list of the 12 most useful Excel functions for data analysis.
To determine how many values fit specific criteria, you may use the COUNTIFS function. In contrast to SUMIFS, it doesn’t need a sum range.
8. TRIM
This smart feature lets you remove all cell spacing except word spaces. The function is often used to get rid of trailing spaces. It usually happens when users copy and paste material from elsewhere or inadvertently add spaces to the end of the text.
9. LEFT/RIGHT
LEFT and RIGHT will do the inverse operation when used in conjunction with CONCATENATE. They will take out a certain amount of characters at the beginning and conclusion of the text.
Parts of an address, URL, or reference may be extracted using this method. Both the LEFT and RIGHT commands make identical data requests. They need the text’s location and the desired character count.
10. VLOOKUP
One of the most famous and widely used features is the vlookup excel function. You may enter a value in one column, and the system will provide data from another column that is relevant to that value.
It’s helpful in comparing two lists for duplicates or missing items or merging data from many lists into a single unified whole. It’s a vital part of Excel’s data analysis arsenal.
There are four fields to fill in:
- An ideal target value
- A table to look at
- Which column contains the data you wish to retrieve?
- What kind of lookup do you want to do?
11. VALUE
In many cases, the data set you need to evaluate has been brought in from someplace else, either by import or copy & paste.
As a result, information may be saved in an unexpected format, such as a numerical value being treated as text. If Excel does not treat them as numbers, you will be unable to execute any data analysis operations, including the SUM.
The VALUE function, however, is available to assist. Its purpose is to do a numerical conversion from textual data.
12. UNIQUE
Only individuals utilizing Microsoft 365 will have access to the brand-new UNIQUE feature.
For this function, there are three pieces of information it requires:
- Select a beginning and ending point from which to get a distinct set.
- Determine if you need to look for unique values in each column or each row.
- No matter whether you are looking for a unique or separate set of things.
13. FILTER
An additional list-filtering function follows the SORT operation. Another feature that is exclusive to Microsoft 365 subscribers.
Inputting a range into this function will filter the input. Analyzing data and generating reports, is a dream come true, as it is a very potent function.
Conclusion on Excel Function Types
Any company, no matter how little, may benefit from using Excel courses. Whether your concentration is on marketing, human resources, sales, or service, you may benefit from these Excel hacks.
Excel functions and formulas provide an effective way of analyzing large data sets quickly and accurately. With the right combination of formulas and functions, you can make intelligent decisions based on your data insights.
Taking advantage of Excel to its full potential can make complicated data analysis a breeze, while providing greater precision in your business decisions.
Don’t miss out on this powerful tool in today’s technologically-driven world – get started with Excel functions and formulas today!
Dan has hands-on experience in writing on cybersecurity and digital marketing since 2007. He has been building teams and coaching others to foster innovation and solve real-time problems. Dan also enjoys photography and traveling.


