

Introduction
In the realm of data science, where statistical techniques act as indispensable compasses, navigating the intricate landscapes of vast datasets to uncover concealed insights and emerging trends, a captivating phenomenon has arisen as a true statistical marvel – Benford’s Law. Within this comprehensive guide, we embark on a journey into the profound depths of Benford’s Law in Data Science, unraveling its pivotal role in the realm of statistics and its pragmatic applications across diverse real-world scenarios.
Table of Contents

Benford’s Law: A Statistical Marvel
Benford’s Law, also known as the First-Digit Law, stands as a remarkable discovery in the field of data analysis. Named after physicist Frank Benford, who identified it in the early 20th century, this law posits that the initial digits of numbers in various naturally occurring datasets do not follow a uniform distribution. Instead, they adhere to a logarithmic pattern. This revelation has far-reaching implications, spanning domains such as fraud detection, quality control, and anomaly identification in financial transactions.
Unveiling the Intricate Patterns
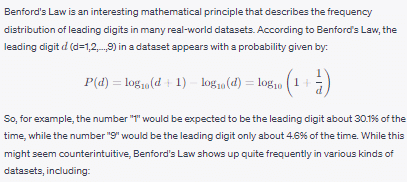
The elegance of Benford’s Law lies in its simplicity. It predicts that the distribution of initial digits in datasets will deviate from the expected uniform distribution (where each digit appears with a frequency of 1/9 or approximately 11.1%). Smaller digits like 1, 2, and 3 manifest more frequently than larger digits such as 8 or 9. For instance, the digit 1 is projected to occur as the initial digit around 30.1% of the time, whereas the digit 9 appears merely 4.6% of the time.
The Mathematical Underpinnings
Benford’s Law transcends mere curiosity, rooted in robust mathematical foundations. It naturally emerges when data spans multiple orders of magnitude and is influenced by exponential growth processes. Also, numbers arising from exponential processes often exhibit a greater likelihood of beginning with smaller digits due to the inherent characteristics of logarithmic scales.
Applications in Fraud Detection
One riveting application of Benford’s Law lies in the domain of fraud detection. Financial data, including tax returns and expense reports, are expected to adhere to this distribution. Deviations from this distribution can signal potential irregularities or fraudulent activities. By comparing the actual distribution of initial digits against the expected distribution according to Benford’s Law, auditors and investigators can pinpoint discrepancies warranting further scrutiny.
Quality Control and Anomaly Detection
Beyond the financial sphere, Benford’s Law finds utility in quality control procedures. Manufacturers, for instance, can use this principle to detect defective products. Also, pronounced deviations in the initial digits of measured dimensions or quantities from the projected Benford’s Law distribution could indicate manufacturing flaws or measurement inaccuracies.
Data Analysis and Digital Forensics
In the arena of data analysis and digital forensics, Benford’s Law offers a distinctive perspective. Also, it’s frequently employed to scrutinize datasets for indications of manipulation or tampering. If the distribution of initial digits in a dataset deviates from what the law prescribes, it could signal data manipulation, prompting a thorough investigation.
Real-world Example: Analyzing Election Data
Scenario
Let’s immerse ourselves in a compelling scenario that exemplifies the applicability of Benford’s Law in the realm of data science, where it becomes a potent tool for scrutinizing the authenticity of election data. Imagine a dataset containing the vote counts for individual candidates in a closely contested election. Also, in this digital era, each candidate’s vote count is expressed as a numerical value, rendering it an ideal candidate for a rigorous Benford’s Law analysis.
The Hypothesis: Unveiling Authenticity and Anomalies
The crux of this analysis lies in a fundamental hypothesis: If the distribution of vote counts conforms to the principles of Benford’s Law, it could signify the integrity and authenticity of the election results. Conversely, deviations from the expected distribution might cast a shadow of doubt, raising concerns about potential vote manipulation or even fraudulent activities.
Application Steps
Data Collection: To initiate the process, it is crucial to begin with the comprehensive collection of vote count data for each candidate participating in the election. To ensure the analytical robustness of our study, it is imperative that this dataset spans across multiple constituencies or regions. Also, this approach will enable us to capture and account for nuanced variations that might potentially exist.
Digit Extraction: Once the data is gathered, the subsequent step involves extracting the first digit from the vote count attributed to each candidate. This initial digit, often referred to as the “most significant digit,” takes center stage in our analysis. Its significance arises from its ability to encapsulate fundamental information about the extent to which the distribution adheres to Benford’s Law.
Expected Benford’s Distribution: At the heart of our analysis lies the computation of an “expected distribution.” Also, this distribution aligns precisely with the patterns predicted by Benford’s Law. This meticulously calculated distribution serves as our foundational reference point against which we will later evaluate the actual distribution that emerges from the collected data.
Actual Distribution: By meticulously tallying the frequency of each first digit’s occurrence within our dataset, we establish what is known as the “observed distribution.” This pivotal step in our process unveils the degree of alignment or divergence between the real-world data and the distribution projected by Benford’s Law.
Comparison and Deeper Analysis: This stage is of paramount importance, involving an intricate examination of the observed distribution in comparison to the expected Benford’s distribution. Also, visual representation through graphs or subjecting the data to rigorous statistical tests provides a deeper and more nuanced understanding of the extent to which the two distributions align or deviate.
Interpreting the Insights
If the observed distribution harmoniously corresponds to the Benford’s distribution, confidence in the authenticity of the election results can be bolstered. This conformity signals that the data adheres to natural distribution patterns, potentially affirming the transparency of the election process.
However, should substantial deviations emerge, a flag is raised, beckoning further investigation. Such deviations may suggest anomalies – be it irregularities in data recording or even deliberate manipulation. Also, this phase necessitates a nuanced examination of contextual factors, data collection processes, and potential sources of bias.
Interpretation
If the observed distribution closely aligns with the expected Benford’s distribution, it suggests that the vote counts are consistent with the natural distribution patterns anticipated by Benford’s Law. This can provide a level of confidence in the authenticity of the election results.
However, if the observed distribution significantly deviates from Benford’s Law, it warrants further investigation. Such deviations might imply anomalies or irregularities in the reported vote counts. Also, factors such as ballot stuffing, data entry errors, or manipulation could be contributing to the discrepancies.
Exploring the Terrain of Application in Data Science
Unveiling the Manifestation
Benford’s Law unveils its presence predominantly in datasets encompassing a wide spectrum of values, characterized by unrestricted numbers. This phenomenon takes center stage in diverse contexts, spanning realms such as financial data evaluation, scrutiny of population figures, and comprehensive analysis of scientific data sets.
Unearthing Anomalies: Role in Data Analysis
Data scientists wield Benford’s Law as a potent tool for unearthing anomalies, identifying errors, and pinpointing potential instances of fraud ensconced within datasets. When a dataset strays notably from the projected distribution dictated by Benford’s Law, it serves as a red flag, signifying possible data manipulation or inaccuracies that necessitate thorough investigation.
Bridging Anomaly Detection and Benford’s Law in Data Science
The marriage between anomaly detection and Benford’s Law transpires through a meticulous process. Data scientists embark on this journey by calculating the anticipated frequency distribution of initial digits, meticulously aligned with the logarithmic patterns intrinsic to Benford’s Law. Subsequently, they juxtapose this projected distribution against the authentic distribution extracted from the dataset. The chasm between the two distributions highlights noteworthy deviations, prompting in-depth examinations of potential anomalies.
Contours of Constraint: Benford’s Law and its Limitations
Boundaries of Statistical Observations
As with any empirical observation, Benford’s Law in Data Science is not a universal panacea. While its influence extends across a plethora of datasets, it does not hold sway ubiquitously. Also, context and domain play pivotal roles; its effectiveness diminishes when applied to datasets sporting confined value ranges or datasets meticulously manipulated to mimic anticipated distributions. Moreover, the interplay of cultural, geographical, and contextual elements further shapes the distribution of primary digits.
Precision in Application: Benford’s Law’s Reach in Data Science
Defining the Scope
Benford’s Law finds its footing primarily within datasets characterized by an expansive span of values. In these scenarios, the distribution of initial digits harmonizes seamlessly with the logarithmic blueprint delineated by the law. However, it grapples less effectively with datasets featuring constricted or predefined value ranges, where its applicability dwindles.
Navigating Benford’s Law Analysis
Evaluating with Methodical Precision
The process of dissecting datasets using Benford’s Law in Data Science demands a systematic approach. Preliminary steps involve the calculation of anticipated initial digit distributions, meticulously structured according to the logarithmic tenets of the law. Also, visualization through histograms or a more quantitative assessment via statistical techniques like the Chi-squared test or Kolmogorov-Smirnov test illuminates disparities warranting scrutiny.
Harmonizing Anomalies and Predictive Modeling
Catalyzing Data Quality
By embedding it as a preliminary phase, analysts can pinpoint potential data discrepancies before weaving predictive models. This proactive stance ensures a solid foundation for predictive analyses, fortified by meticulous anomaly detection and rectification.
In conclusion, the intricacies of Benford’s Law in Data Science unveil a logarithmic symphony underlying first-digit distributions. From its emergence in diverse datasets to its role in anomaly detection and data analysis, this law encapsulates a paradigm. Acknowledging its limitations and harnessing its precision, analysts can unravel hidden insights and fortify the bedrock of data-driven decision-making.
Comma Style in Excel: A Comprehensive Guide to Comma Style in Excel – projectcubicle

A dedicated Career Coach, Agile Trainer and certified Senior Portfolio and Project Management Professional and writer holding a bachelor’s degree in Structural Engineering and over 20 years of professional experience in Professional Development / Career Coaching, Portfolio/Program/Project Management, Construction Management, and Business Development. She is the Content Manager of ProjectCubicle.


