

The precedence diagramming method is what most project management software uses by default when you build a schedule network — and most users of those tools have never actually done the underlying calculations by hand. That’s a problem, because the software output only makes sense if you understand what it’s doing. When a task shows zero float and you don’t know why, or when a change to one activity unexpectedly shifts the project end date, the forward pass and backward pass are what explain it. This article walks through a complete precedence diagramming example step by step — including the four dependency types and lag/lead that most guides skip.
Table of Contents
What Is the Precedence Diagramming Method?
Precedence Diagramming Method (PDM) is a visual representation technique used to prepare the project network diagram and determine the critical path. Unlike the arrow diagramming method, activities in PDM are presented as boxes (nodes), not as arrows. One of the main advantages of PDM is that it demonstrates activity relationships through four distinct dependency types, rather than only finish-to-start.
It is critical for a project manager to understand activity relationships because they drive the project schedule. For a full precedence diagramming example with calculations, follow the steps below.
PDM is sometimes called Activity-on-Node (AON) — the activity name and duration sit inside the box, not on the arrow. This contrasts with Activity-on-Arrow (AOA), where activities are the arrows and nodes represent events. Modern scheduling software — MS Project, Primavera P6, and most other tools — uses PDM by default. If you’ve ever looked at a Gantt chart with dependency lines, those dependencies are PDM relationships expressed in bar chart form.
The Four Dependency Types — With Real Examples
PDM supports four types of logical relationships between activities. This is one of the key advantages over the arrow diagramming method, which natively handles only finish-to-start. Understanding which relationship type to use matters — getting it wrong creates a schedule that doesn’t reflect how the work actually flows.
Finish-to-Start (FS)
The most common. Activity B cannot start until Activity A finishes. Example: concrete cannot be poured until formwork is complete. Almost all basic dependencies in construction, engineering, and software development are FS. This is the default in most scheduling tools.
Start-to-Start (SS)
Activity B cannot start until Activity A starts. Example: testing cannot start until coding starts — you don’t need coding to finish before testing begins, but testing can’t begin before any code exists. SS relationships model overlapping work and are common in projects using fast-tracking.
Finish-to-Finish (FF)
Activity B cannot finish until Activity A finishes. Example: quality inspection cannot finish until production finishes — inspection may have started earlier, but it can’t be completed until there’s nothing left to inspect. FF is common in parallel workstreams that need to close together.
Start-to-Finish (SF)
Activity B cannot finish until Activity A starts. This is the rarest relationship — genuinely uncommon in practice, though it appears regularly in PMP exam questions. A real example: a night security shift (Activity B) cannot end until the day shift (Activity A) begins. SF appears occasionally in handover or “just-in-time” scheduling scenarios. In practice, most apparent SF relationships can be remodeled as FS with a lag, which is usually cleaner.
If you’re working through a precedence diagramming example and encounter SF, double-check whether FS with a lag wouldn’t express the same logic more clearly.
| Type | Meaning | Practical example |
|---|---|---|
| FS | B can’t start until A finishes | Install cables after conduit is laid |
| SS | B can’t start until A starts | Testing starts after coding starts |
| FF | B can’t finish until A finishes | Inspection ends when production ends |
| SF | B can’t finish until A starts | Night shift ends when day shift starts |
Lag and Lead in the Precedence Diagramming Method
PDM allows modifiers to be applied to any dependency relationship: lag adds a waiting period, lead allows overlap. These are more powerful than they appear and are a common source of scheduling errors when misunderstood.
Lag is a delay between the predecessor and successor. FS with a 2-day lag means the successor can start 2 days after the predecessor finishes, not immediately. In construction, this models curing time — concrete needs 7 days after pouring before the next activity can begin. Lag is positive time added to the relationship.
Lead is negative lag — it allows a successor to start before its predecessor is complete. FS with a 3-day lead means the successor can start 3 days before the predecessor finishes. This is how fast-tracking is typically modeled in PDM: overlapping activities that would normally be sequential. Lead increases schedule risk because it assumes the predecessor’s remaining work will complete as expected.
A common mistake: using lag to hide scope that isn’t planned. A 14-day lag on a relationship where the actual work is procurement or engineering is hiding a missing activity. The lag should model genuinely passive waiting time — curing, drying, waiting for regulatory approval — not unplanned work. When float analysis produces unexpected results, undocumented lag is often the explanation — and it’s easier to spot when you trace the precedence diagramming example by hand rather than relying on software output.
Precedence Diagramming Method EXAMPLE AND Calculation Steps
In this precedence diagramming example, A, B, C, D, F, G, H, I are the activities. Numbers above the boxes are the durations. Activity B is a predecessor activity that logically comes before Activity F. Activity F is a successor that comes after Activity B. There is a Finish-to-Start relationship between Activity B and F.
Step 1: PDM Forward Pass Calculation
In this precedence diagramming example, we will perform forward and backward pass calculations. Forward Pass Calculations specify the minimum dates at which each activity can be performed and, ultimately, the minimum duration of the project.
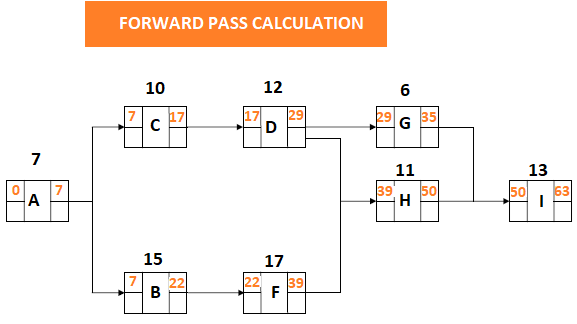
The forward pass works left to right through the network. The Early Start (ES) of the first activity is day 0 (or day 1 depending on convention — pick one and stay consistent throughout). Early Finish (EF) = ES + Duration. When multiple predecessors feed into one activity, the largest EF among all predecessors becomes the ES of the successor. This is the “late predecessor governs” rule — the successor can’t start until every one of its predecessors is done.
A simple example to anchor the logic: if Activity A has duration 4 and starts on day 0, its EF is day 4. If Activity B has duration 3 and also starts on day 0, its EF is day 3. If Activity C requires both A and B to finish before it starts, C’s ES is day 4 — the larger of the two EFs. The fact that B finishes earlier doesn’t help; C still waits for A. This is the calculation that catches people on PMP exam questions — the instinct to take an average or pick the earlier date is wrong.
Step 2 : PDM Backward Pass Calculation
Backward Pass Calculations determine the latest dates by which each activity can be performed without increasing the projects minimum duration.
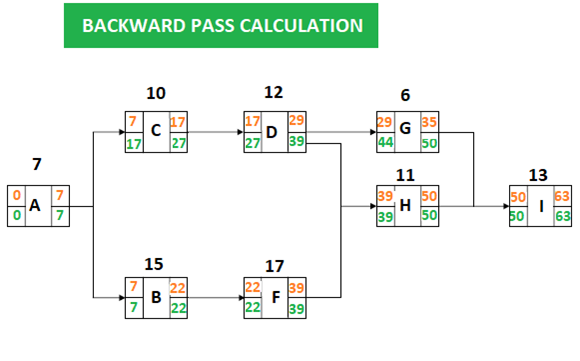
The backward pass works right to left, starting from the project end date established by the forward pass. Late Finish (LF) of the last activity equals its Early Finish. Late Start (LS) = LF − Duration. When an activity has multiple successors, its LF is the smallest LS among all successors — because it must finish before any successor needs to start.
The backward pass is where most calculation errors occur. The rule to remember: when branching backward through multiple successors, take the minimum — not the maximum. Taking the maximum produces a schedule that would delay at least one successor, which violates the logic.
Continuing the earlier example: if Activity C (duration 5) has ES day 4 and LF day 20, its LS = 20 − 5 = day 15 and total float = LS − ES = 15 − 4 = 11 days. If Activity D (duration 6) has ES day 4 and is on the critical path with zero float, its LS = ES = day 4 and LF = day 10. Now if Activities C and D both succeed from Activity A (duration 4, ES day 0, EF day 4), Activity A’s LF = minimum(LS of C, LS of D) = minimum(15, 4) = day 4. Activity A’s float = LF − EF = 4 − 4 = 0. Activity A is critical even though C has 11 days of float — because D is critical and D depends on A.
Step 3 : PDM Float Calculation for Each Activity / Precedence Diagramming Method Example
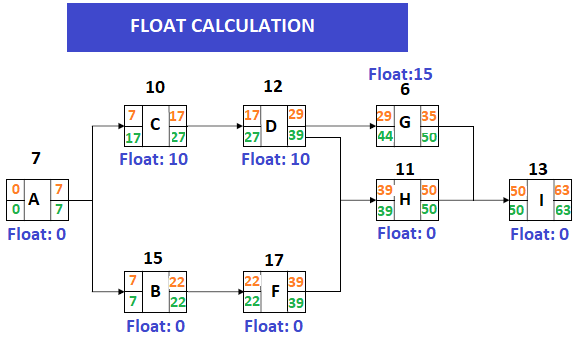
Total Float = LS − ES (or equivalently LF − EF). Float represents how much an activity can be delayed without delaying the project end date. Positive float means the activity has scheduling flexibility. Zero float means the activity is on the critical path — any delay to it delays the project.
Negative float is also possible and worth understanding in any precedence diagramming example with an imposed deadline. Negative float appears when a project has an imposed deadline earlier than the calculated project duration from the forward pass. For example, if the forward pass shows a project duration of 45 days but the contract requires completion in 40 days, the network will show −5 days of float on critical path activities. This doesn’t mean the schedule is impossible — it means you need to find 5 days of compression through crashing, fast-tracking, or scope reduction. Negative float is a signal, not a calculation error.
Step 4 : PDM Identifying the critical path / Precedence Diagramming Method Example
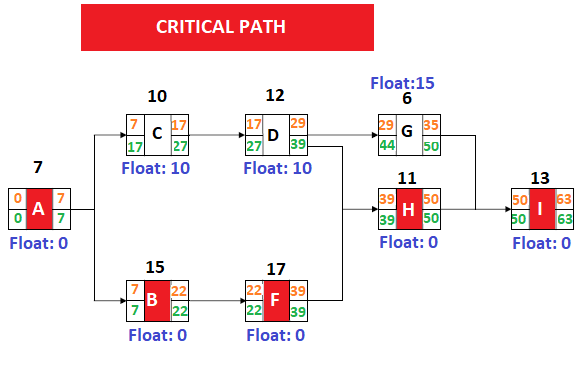
Activities with zero total float form the critical path. The critical path is the longest path through the network from start to finish — it determines the minimum project duration. Any delay to a critical path activity delays the project end by the same amount.
A project can have more than one critical path. Multiple paths with zero float means more activities that can’t slip without delaying completion — which increases schedule risk and requires more intensive monitoring. In practice, schedulers also watch activities with small but positive float (one or two days on a multi-month project) as a “near-critical path,” because a modest delay or resource conflict could push them to zero and create a new critical path without warning.
Precedence Diagramming Method vs Arrow Diagramming Method
Both PDM and the arrow diagramming method produce a network diagram and calculate the critical path using the same underlying mathematics. The difference is notation and capability.
In ADM (Activity-on-Arrow), activities are the arrows and events are the nodes. In PDM (Activity-on-Node), activities are the boxes and the arrows show dependencies. The practical consequences: PDM supports all four dependency types natively. ADM only handles finish-to-start without workarounds. ADM requires dummy activities to handle certain parallel dependencies; PDM doesn’t. Modern scheduling software defaults to PDM for these reasons. ADM still appears on the PMP exam and in industries with legacy scheduling systems, so understanding both is useful — but for new projects PDM is the standard.
| PDM (Activity-on-Node) | ADM (Activity-on-Arrow) | |
|---|---|---|
| Activities on | Boxes (nodes) | Arrows |
| Dependencies on | Arrows | Nodes |
| Dependency types | All four (FS, SS, FF, SF) | Finish-to-Start only |
| Dummy activities | Not needed | Sometimes required |
| Software support | Standard default | Legacy systems only |
Reading Float Correctly: Total Float vs Free Float
The precedence diagramming method example above shows total float — how much an activity can slip without delaying the project end. But total float doesn’t tell you whether delaying that activity would delay a specific successor. That’s what free float measures.
Free float = Early Start of successor − Early Finish of the activity. An activity can be delayed by its free float without affecting any successor’s early start. Total float can be shared between activities on the same path — using it on one activity reduces the total float available to others on the same path. Free float belongs to the individual activity and doesn’t affect others.
In practice: if you’re planning to delay an activity and you want to know whether it affects the next team’s start date, look at free float. If you want to know whether it affects the project end date, look at total float. Most scheduling software shows total float by default. Free float is often available as a separate field but gets overlooked.
One more thing worth noting in any precedence diagramming example: the critical path identified at planning is not necessarily the critical path during execution. If a critical activity finishes ahead of schedule, or a near-critical activity is delayed, the critical path shifts. Re-running the calculations periodically during the project — not just at baseline — is what makes the network analysis useful rather than a planning artifact.

Irma Gilda is chief executive of Sonic Training and Consultancy Co., the training platform offers project planning and scheduling More than 60 k learners have used the platform to attain professional success. Irma is a professional Primavera P6 Trainer.


Why don’t you add one day for the next activity? how can you finish and start the two activities on the same day?
The way it works is that the first activity starts at the beginning of day 1 or at 0 days so the eight as a starting times indicate end of day/beginning of the next day. For example activity C starts at the end of day 7 which is also the beginning of day 8. For PDM though the principle is to show end of day for beginning of an activity.