What Is A Project Flow Chart?
As a project manager, you will be needing a variety of tools to keep the project under control, among which is a project management flow chart. A project flow chart is graphic assistance in project management. The figure depicts the parallel and interconnected processes within the project plan, enabling you to effectively manage your project by seeing the entire project cycle. On the other hand, it can assist you with progress tracking and even status updates.
Table of Contents
If you are new to this job, then you are at the right place. We will make sure to give you the basic essential information regarding the project flowchart. Above have we given the hint of what flowchart is now, continue reading to know about the purpose of it and how one can attempt to make a flowchart.
What is the Purpose of a Project Flow Chart?
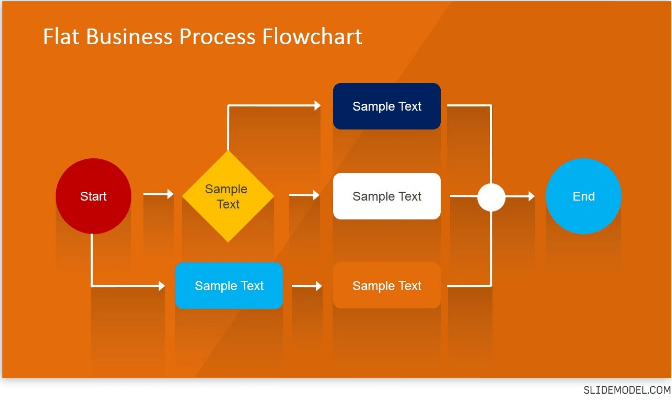
A general project management flow chart is a diagram that depicts a series of actions that begin with the commencement and progress of a project leading to a conclusion. However, if the project statement is not accepted, you’ll have to amend or terminate the project. As soon as your scope statement is accepted, you can move forward with the strategic planning. Strategic planning of a project includes various steps which are explained in detail below.
The Project Plan
It all begins with planning, gathering requirements, and defining the scope. That information can be used to create level indicators or scorecards; both of them would lead you to the project plan. Then, of course, that strategy leads to the resources, budgets, and timetables, among other things. Each of these subgroups leads to a different point in the flowchart, like the risk or communications plan, which then leads to controlling the changes and quality management plans. You will eventually reach approval, which will proceed to the execution procedure, or you will not get approval, which will bring you back to where you started.
The Implementation of a Strategy
Execution can have a separate flowchart which would lead to the formation of the project’s workforce, the acquisition of assets for quality assurance, and the distribution of information. You can later alter, cancel, or continue. The option you select would either take you back to the beginning, would cancel that phase, or let you jump on to the following procedure.
Tracking and Controlling
A flowchart begins with the project’s control and monitoring processes while ending with an integrated transformation control plan. This leads to quality assurance, further leading to the reporting of risks and issues, and so on.
Project Completion
Closing a project is also a process that may be depicted in a flow chart. Begin with the project’s completion, followed by activities such as the verification and confirmation of deliverable and functioning, and finally, the shift to the knowledge gained by the end of it.
The Entire Project Cycle
The entire project cycle can be summarized in a project management flow chart only if you wish to do so. Doing so will come in handy, enabling you to share the project cycle with others easily or utilize it independently. This flowchart would begin with the initial stage of the project and progress through the establishment of the project, documents, job assignments, conferences, agendas, and reports, and so on. Each of which can lead you to a separate stream. For instance, project creation would lead you to project status monitoring and documentation leading to the project’s budget, and the list goes on.
Types of Project Flow Charts
There is a wide variety of flow charts. We have listed the most common ones below.
Workflow Diagram
A workflow diagram is a tool for visualizing and managing workflow. You can concentrate on the integration of the process and the tasks assigned to the team. Here the goal is to achieve consistent quality.
Process Flowchart
When creating a service or a product, this flowchart is utilized to assess the flow of the activities going on. In addition, it depicts the interrelationships between all of the project’s major components.
Value Stream Mapping
This flowchart is commonly used in production to assess and create the material flow at the systemic level.
Data Flow Chart
When conducting computer modeling, this is an excellent tool. It demonstrates how data is handled and can be applied to data management, modeling, and other applications.
The Swimlane Flow Chart
Incorporating this flowchart will divide the flow into columns. Doing so will aid in the organization of activities into distinct visual groups that depict various tasks or roles.
How to Draw a Project Flow Chart?
A flow chart can be created in a variety of ways. Flow charts were conventionally made by hand on paper, but now, with constant technological advances, there are many programs to create flow charts easily. Now you can utilize the flow chart template without having to make it from scratch. By utilizing these, you will only be required to add in the relevant information.
At first glance, this appears to be a straightforward task that seems like almost everyone can do. However, making it truly accurate is not a piece of cake. Considering the procedure from a management standpoint is one thing, whereas truly comprehending what it entails, including the steps, approaches, and tools is another.
Symbols in Project Flow Charts
Flow chart symbols have distinct significance, much as word usage does. The flowchart contains a variety of shapes, but there are two forms in this case: circles and rectangles. Circles represent the points from where the start and end of the procedure are. On the other hand, we have rectangles; they are utilized to symbolize the intermediate steps.
Conclusion
We hope that the above discussion might add knowledge to your think tank. Then, develop your flowchart considering the information we gave you in this article and see how it helps execute your project plan better.

Keith Brandon is a senior director of Keboth Training and Education Co. In addition to leading Keboth’s global team, he developed Keboth’s online training system that offers advanced learning solutions for professionals.


