Icon Sets in Excel: Unveiling the Power of Visual Data Interpretation
The Essence of Icon Sets in Excel
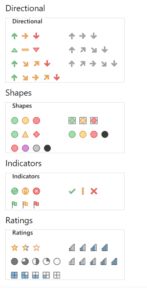
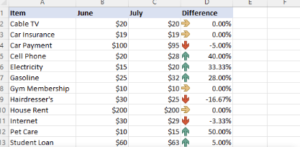
Icon Sets in Excel are a part of the Conditional Formatting feature that allows users to apply visual indicators—icons—to data cells based on their values. This can range from simple arrows and shapes to indicators of progress, flags, and ratings. The beauty of Icon Sets lies in their ability to convey complex information at a glance, turning rows of numbers into a visually intuitive narrative. Whether you’re tracking sales performance, analyzing survey results, or managing inventory levels, Icon Sets offer a quick, at-a-glance understanding of your data’s story.
Table of Contents

Icon Sets in Excel
Why Embrace Icon Sets in Your Excel Sheets?
The use of Icon Sets can dramatically enhance the readability and interpretability of your data. Here’s why incorporating them into your Excel workflow is a game-changer:
- Immediate Data Insights: Icons can highlight trends, outliers, or critical values instantly, making it easier for you and your audience to spot important information without delving into the weeds.
- Enhanced Data Presentation: In presentations or reports, visual elements like Icon Sets can make your data more accessible and engaging to a wider audience.
- Customizable to Fit Your Needs: Excel offers a variety of Icon Sets, and with a bit of tweaking, you can customize them to better suit your data storytelling needs.
Diving Into Icon Sets: A Closer Look
Excel provides a plethora of Icon Sets to choose from, each suited for different types of data analysis and presentation. These range from directional arrows indicating increase or decrease, traffic lights for status assessment, to stars for rating systems. The process of applying these icons is straightforward, yet the impact on data comprehension is profound.
How to Implement Icon Sets in Your Data
Implementing Icon Sets in Excel is a breeze. Here’s a simplified step-by-step guide:
- Select Your Data Range: Highlight the cells you want to apply the Icon Sets to.
- Navigate to Conditional Formatting: Found under the “Home” tab, this is where the magic begins.
- Choose ‘Icon Sets’: Click on ‘Conditional Formatting’, hover over ‘Icon Sets’, and select the set that best fits your data’s narrative.
- Customize (Optional): For a more tailored approach, delve into the ‘Manage Rules’ option to adjust when and how the icons appear based on your data.
Tips for Maximizing the Impact of Icon Sets
- Understand Your Data: Before choosing an Icon Set, ensure you understand what story you want your data to tell. This understanding will guide you in selecting the most appropriate icons.
- Less is More: While it’s tempting to use various Icon Sets for different data ranges, simplicity often leads to clearer insights.
- Customization is Key: Don’t shy away from customizing the default settings. Adjusting the thresholds for when icons appear can make them even more impactful.
The Future of Data Visualization with Icon Sets
As we move further into the era of big data, the importance of effective data visualization becomes increasingly paramount. Icon Sets in Excel are just the beginning. With ongoing updates and the potential for more customizable and dynamic icon options, the future looks bright for Excel users seeking to elevate their data presentation game.

Icon Sets in Excel
Wrapping Up
Icon Sets in Excel offer a powerful yet simple way to enhance your data analysis and presentation efforts. By leveraging these visual tools, you can transform complex data into accessible and insightful visual stories. Whether you’re a seasoned data analyst or a newcomer to Excel, integrating Icon Sets into your data practice can illuminate patterns and trends that numbers alone might not reveal.
As we’ve journeyed through the world of Icon Sets, it’s clear that their value extends beyond mere aesthetics; they are a crucial tool in the modern data analyst’s toolkit. So, the next time you find yourself lost in a sea of data, remember: Icon Sets are your lighthouse, guiding you to clearer understanding and more impactful data storytelling.
FAQs on Icon Sets in Excel
Q1: What are Icon Sets in Excel? A1: Icon Sets are a feature within Excel’s Conditional Formatting options that allow users to apply visual symbols to data cells based on their values. Also, these icons can range from directional arrows and traffic lights to ratings stars, offering a visual method of data analysis and presentation.
Q2: How do I apply Icon Sets to my data in Excel? A2: To apply Icon Sets, select your data range, go to the “Home” tab, click on “Conditional Formatting,” hover over “Icon Sets,” and choose your preferred set. For more detailed customization, you can adjust the rules under “Manage Rules” within the Conditional Formatting options.
Q3: Can I customize the icons used in Icon Sets? A3: Yes, Excel allows customization of Icon Sets. You can change the criteria for when specific icons are shown by modifying the rules in the “Manage Rules” option under Conditional Formatting. This includes setting value thresholds or applying formulas to determine which icons appear for different data points.
Q4: Are there limitations to using Icon Sets in Excel? A4: While Icon Sets are a versatile tool, they do have limitations. For instance, the number of icons in a set is fixed, and you cannot create a completely custom set from scratch within Excel. Also, excessive use of icons can clutter your data presentation, so it’s best to use them judiciously.
Q5: How can Icon Sets improve my data analysis? A5: Icon Sets provide a visual layer to data analysis, making it easier to spot trends, outliers, or critical points at a glance. This can improve the efficiency of your data review process and help convey complex data insights more intuitively to others.
Where is Icon Sets in Excel?
Icon Sets are located within the Conditional Formatting feature of Excel. Here’s how you can find them:
- Open your Excel workbook and select the cells you want to format. (conditional formatting in excel icon sets)
- Click on the “Home” tab on the ribbon.
- In the “Styles” group, click on “Conditional Formatting.”
- Hover over “Icon Sets” in the dropdown menu, and you’ll see a variety of icons to choose from.
How Do You Insert Icons in Excel?
To insert Icon Sets as a part of Conditional Formatting:
- Select the range of cells you wish to format.
- Go to the “Home” tab, and click on “Conditional Formatting.”
- Choose “Icon Sets” from the menu, and select the set that best fits your data analysis needs.
For inserting standalone icons (not part of Icon Sets):
- Click on the “Insert” tab on the ribbon.
- Click on “Icons” to choose from a variety of available symbols and graphics.
Can You Change the Rules?
Yes, you can customize the rules for Icon Sets:
- After applying an Icon Set, go back to “Conditional Formatting” on the “Home” tab.
- Select “Manage Rules” to view the Conditional Formatting Rules Manager.
- Choose the rule associated with your Icon Set and click “Edit Rule.”
- Adjust the criteria for icon display according to your preferences and click “OK.”
How Do I Align Icon Sets in Excel?
Icon Sets in Excel are typically aligned with the cell’s content. To adjust the alignment:
- Select the cells with the Icon Sets.
- Go to the “Home” tab, and find the “Alignment” group.
- Click on the alignment options (e.g., “Align Left,” “Center,” or “Align Right”) to adjust the position of both the icons and the cell content.
Why Use Icon Sets in Excel?
Icon Sets are used in Excel to visually categorize and highlight data, making it easier to analyze and understand at a glance. They are particularly useful for:
- Identifying trends, patterns, and deviations.
- Enhancing data presentation and reports.
- Simplifying complex data sets for better accessibility and comprehension.
How Do I Fix an Icon Alignment?
To fix an icon alignment issue in Excel, especially if icons are not properly aligned with the text or within the cell, follow these steps:
- Check the cell’s alignment settings (as mentioned above) and adjust if necessary.
- If the icons are part of Conditional Formatting (conditional formatting in excel icon sets), you might need to adjust the cell’s overall formatting (conditional formatting in excel icon sets) to ensure consistency. This includes modifying the cell size, font size, or directly adjusting the icon’s alignment settings in the “Manage Rules” section of Conditional Formatting.
- For misaligned standalone icons, you can also use the “Format” (conditional formatting in excel icon sets) options under the “Picture Tools” or “Graphics Tools” tabs that appear when an icon is selected, allowing for more precise control over the icon’s position.

Daily motivation for projectcubicle.com
Hello, I’m Cansu, a professional dedicated to creating Excel tutorials, specifically catering to the needs of B2B professionals. With a passion for data analysis and a deep understanding of Microsoft Excel, I have built a reputation for providing comprehensive and user-friendly tutorials that empower businesses to harness the full potential of this powerful software.
I have always been fascinated by the intricate world of numbers and the ability of Excel to transform raw data into meaningful insights. Throughout my career, I have honed my data manipulation, visualization, and automation skills, enabling me to streamline complex processes and drive efficiency in various industries.
As a B2B specialist, I recognize the unique challenges that professionals face when managing and analyzing large volumes of data. With this understanding, I create tutorials tailored to businesses’ specific needs, offering practical solutions to enhance productivity, improve decision-making, and optimize workflows.
My tutorials cover various topics, including advanced formulas and functions, data modeling, pivot tables, macros, and data visualization techniques. I strive to explain complex concepts in a clear and accessible manner, ensuring that even those with limited Excel experience can grasp the concepts and apply them effectively in their work.
In addition to my tutorial work, I actively engage with the Excel community through workshops, webinars, and online forums. I believe in the power of knowledge sharing and collaborative learning, and I am committed to helping professionals unlock their full potential by mastering Excel.
With a strong track record of success and a growing community of satisfied learners, I continue to expand my repertoire of Excel tutorials, keeping up with the latest advancements and features in the software. I aim to empower businesses with the skills and tools they need to thrive in today’s data-driven world.
Suppose you are a B2B professional looking to enhance your Excel skills or a business seeking to improve data management practices. In that case, I invite you to join me on this journey of exploration and mastery. Let’s unlock the true potential of Excel together!
https://www.linkedin.com/in/cansuaydinim/


