Excel program can work for everyone. You may be working in HR or more technical department like Finance. But it has some great tools to help make creating charts easy for all users in each level. Because there are lots of chart templates in Excel. So that you can use as a starting point for new templates.
Table of Contents
Chart Templates in Excel
When you open Excel, the default workbook opens. This is the workbook where all of your data you will write and store. You will also see a few tabs across the top. These are Home, Insert, Page Layout and Formulas. The Home tab is where you can find most of the commands for working with text, numbers, cells and formatting. While here we have Insert tab. And it comes with commands for inserting objects like pictures and tables into your worksheet. As well as commands for creating charts.
Where to Find chart design in Excel?
The Page Layout tab on the other hand, has commands for manipulating the appearance of pages and sections in your workbook. And we cannot imagine Excel without its functions or formulas. So, the Formulas tab contains formulas and functions for many cases. So that, you can use to calculate values or perform other operations on data.

excel chart templates
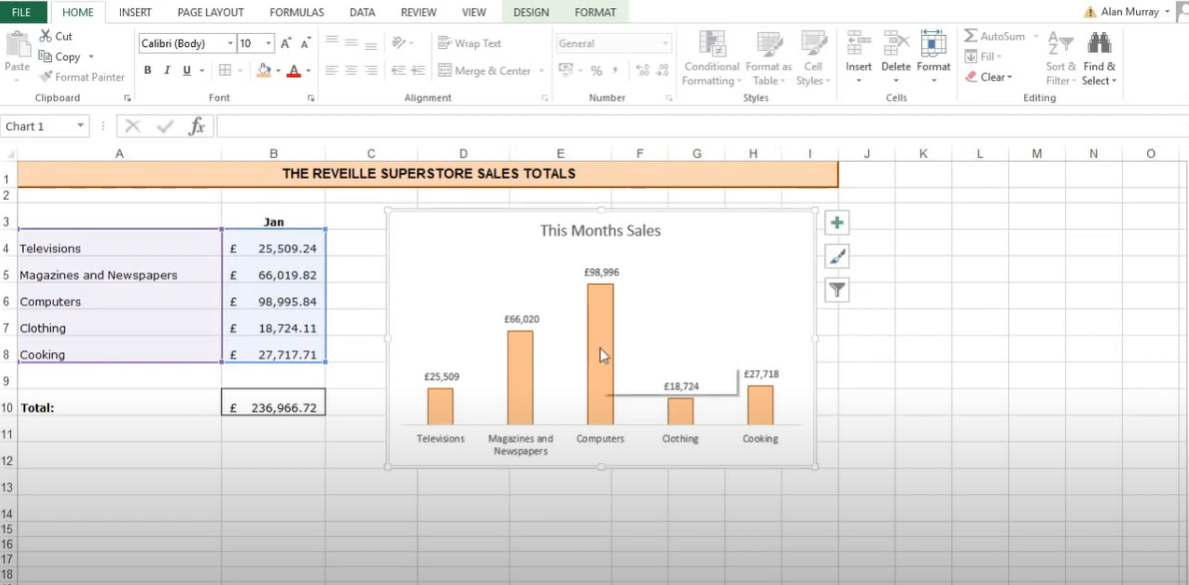
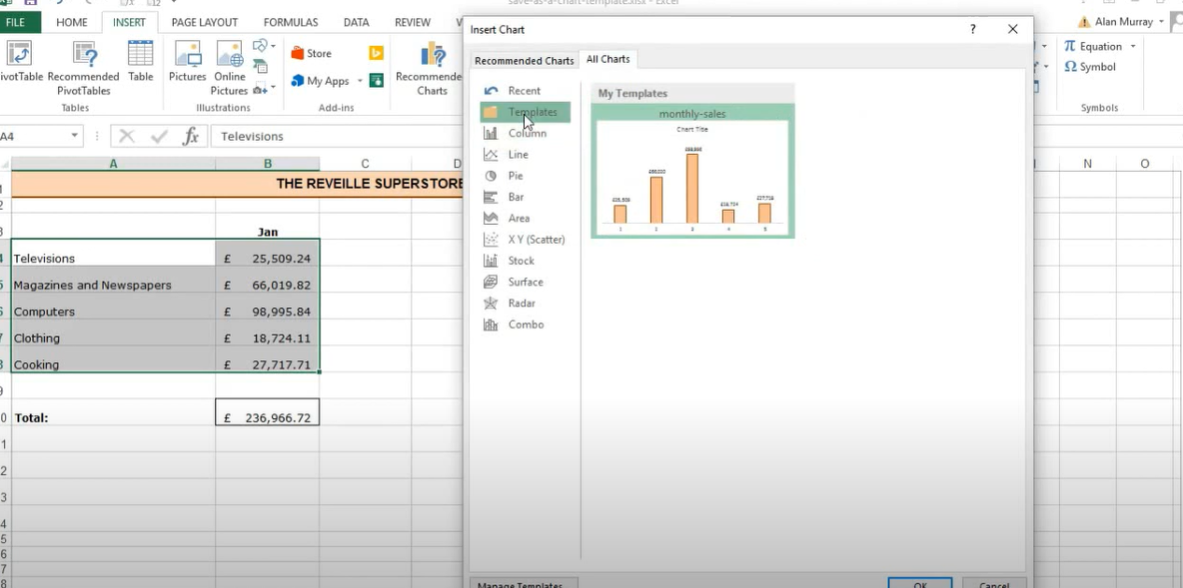
In case you wish to find the chart templates, you should click on the Insert tab and select Chart. You will see a menu with a variety of chart types. Here you can select the type of chart you want to create. And then click on the template you want to use.
So now, Excel will then open a new workbook with selected template. You can enter your own data into the template and customize your chart’s appearance. To do this, you click on the Design tab when creating a new chart. You can change the color scheme, add or remove elements and also experiment with different layouts.
excel graph templates: Where do I find chart design in Excel?
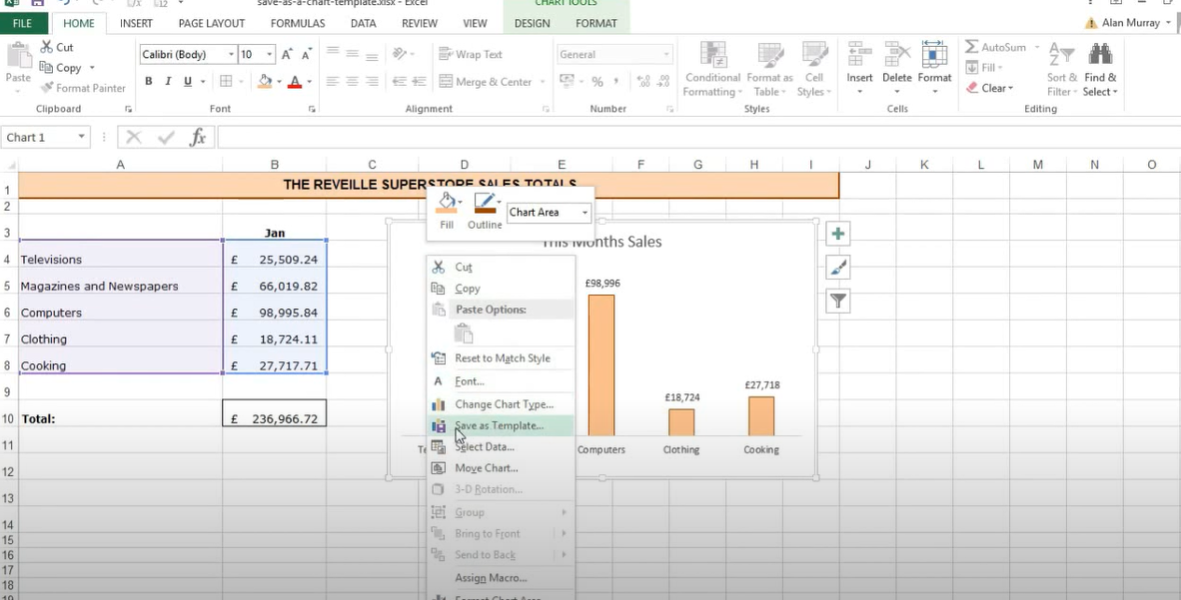
- When you are ok with your chart, you can save it as its own file or insert it into another workbook.
- If you anna insert it into another workbook, you will click on the chart and then select Copy from the Home tab.
- Now, it is time to open the workbook where you want to insert. And then, you should select Paste from the Home tab. The chart will come here as an object. So that you can move and resize.
Where to find chart templates in Excel? sample excel charts
Ok, in case you need chart templates in Excel, you can find collection of templates in Excel. For accessing these, you should open up Excel. And then, you can click on File tab. Then, you will select New from menu.
You have now a New Workbook page. And you will see a variety of templates here. Such as several options for different types of charts. You can scroll through the list and find the template with best looking. Then, you can click on it to select it. And now, you should go to Create button to open up a new workbook using that template.
how to use excel chart templates
If you could not find what you are looking for in Excel chart templates, there are some other platforms to look
- One option is to search for Excel chart templates in web. This will give you various results. And they can be both free and paid options.
- Another option is, you can buy a template pack from online Excel templates. These packs usually include a wide variety of charts. So you are likely to find what you are looking for.
- Once you found a template online or in packages, you will download it to your PC. And then, you will open it up in Excel. It is an option to start customizing tough.
How to Make a custom chart in Excel? chart templates excel
Yes, you can make a custom chart in Excel. For that, you should click on Insert tab and then select Chart. This will open up the Insert Chart box.
- Here, you can see a list of different chart types on the left. So, you should find the type of chart that you want to create and then click on it to select it.
- Once selected a chart type, you can then start customizing it by adding your own data. For this, you will click on Data and then enter your data into the cells. Once you are ok, you should click on the OK button to insert your custom chart.

How do I create an attractive chart?
Ok, if you have your data set up in excel, there are a few ways to create an attractive chart. It comes to a bit creativity tough. You can use all ready ones or you can start designing with cells and columns.
One way is to use the built-in chart templates. Excel will then present you with a number of different options here.
Conclusion on Chart Templates in Excel
For custom charts, you can select the specific elements of your chart. Such as the title, axes, data series and so on. And then, you can format them for preferences.
Creating an attractive chart in excel is a personal preference. However, using these templates or the Chart Tools options will give you the most control over your charts.

A dedicated Career Coach, Agile Trainer and certified Senior Portfolio and Project Management Professional and writer holding a bachelor’s degree in Structural Engineering and over 20 years of professional experience in Professional Development / Career Coaching, Portfolio/Program/Project Management, Construction Management, and Business Development. She is the Content Manager of ProjectCubicle.


