

This critical path method example article covers the full calculation — forward pass, backward pass, float — and the execution problem that makes most CPM implementations less useful than they should be. The critical path method tells you which activities in a project schedule are driving the end date, and by how much every other activity can slip before it starts affecting that date. The actual output is a list of activity names — these specific activities are on the critical path, everything else has some float. Most implementations produce the diagram and stop there, which is why so many projects that claim to use CPM still end up with end-date surprises that nobody saw coming.
Table of Contents
Where CPM Came From
CPM was developed at DuPont in the 1950s for plant shutdown scheduling — maintenance turnarounds where hundreds of interdependent tasks needed to be sequenced and a Gantt chart couldn’t show which ones were actually blocking the others. The PERT method came out of the US Navy Polaris programme around the same time, using three-point estimates instead of single-point ones. CPM became standard. PERT didn’t disappear but it’s now mostly confined to sectors where probabilistic scheduling is contractually required.
The DuPont context matters because CPM was designed for a specific kind of project: well-defined technical activities, experienced crews, predictable durations, hard physical dependencies. It works well there. Most of what gets scheduled using CPM isn’t quite like that — scope shifts, durations get estimated by people who haven’t done the work before, dependencies turn out to be softer than assumed. The method still applies, but the outputs are more uncertain than the precise-looking numbers suggest.
What the Critical Path Method Actually Is
The critical path method is the process of identifying which activities in a project network are driving the end date. The “critical path” is the sequence of activities whose combined duration equals the total project duration — delay any of them and the project end moves by the same amount.
The PMBOK Guide definition — “the sequence of scheduled activities that determines the duration of the project” — tells you what the critical path is. It doesn’t tell you what to do with it. In a progress meeting the useful version is something like: structural frame, concrete topping slab, mechanical rough-in are the three activities you can’t let slip this month. The rest have float. That’s the level of specificity that makes CPM worth the effort of maintaining.
A project schedule has multiple paths from start to finish. Each path has a total duration — the sum of the activities on it. The longest path is the critical path. Activities on it have zero float. Activities on shorter paths have float equal to the difference between their path duration and the critical path duration.
A project can have more than one critical path if two or more paths tie for longest duration. Multiple critical paths mean more activities that can’t absorb delay, which is generally a sign the schedule is tight and fragile. Schedulers also watch the near-critical path — activities with small float that could easily become critical if something small goes wrong. On a nine-month project, I’d be watching anything with less than a week of float almost as closely as the critical path itself.
How to Calculate the Critical Path
Start with a complete activity list
Start with a complete activity list, usually from the Work Breakdown Structure. Missing activities produce a wrong critical path silently — the calculation runs, the result looks reasonable, and the error only surfaces when the missing work appears during execution and the programme needs restructuring to fit it in.
Dependencies — which ones are actually mandatory
Some dependencies are physically unavoidable — you can’t commission equipment before it’s installed, you can’t install before procurement is complete. Others are softer — sequenced because it seemed logical when someone drew the programme two years ago, and nobody’s questioned them since. On a utilities infrastructure project I was reviewing, a six-week design review appeared mandatory — it had been on every programme revision for two years. When we asked whether it actually was, the answer was no. The contractor’s commercial team had added it as a precaution on the original programme and nobody had questioned it since. Removing it recovered five weeks from the critical path. I’d expect to find at least one sequence like that on most programmes if you look for them.
The network diagram and duration estimates
Modern software builds the network automatically as you enter predecessors. The convenience is real but it means most people never look at the underlying logic. I’ve reviewed programmes where the network had circular dependencies that the software had silently resolved — an activity appearing as its own predecessor somewhere in a chain, creating a loop the tool quietly broke without flagging. Worth checking the network diagram periodically rather than trusting the Gantt chart representation of it.
Duration estimates are the weakest part of the model. Two experienced schedulers estimating the same activity will produce different numbers, sometimes substantially different, because duration depends on assumptions about crew size, productivity, weather, complexity — none of which the activity name captures. The CPM calculation treats whatever number you give it as a fact. It has no way of knowing whether an estimate is realistic or conservative or optimistic. The output looks precise regardless.
Forward pass, backward pass, float
The forward pass works left to right: Early Start of the first activity is zero. Early Finish = Early Start + Duration. When multiple predecessors feed into one activity, its Early Start is the largest of their Early Finishes. The backward pass works right to left from the project end date, calculating Late Finish and Late Start for each activity. Total Float = Late Start minus Early Start. Zero float = critical.
Negative float means the project as scheduled can’t meet its imposed deadline. The software will show it; it doesn’t mean the calculation broke. It means the programme needs compression — either fast-tracking critical path activities or crashing them — to recover the gap. See the schedule compression article for how that works.
Critical Path Method Example: Worked Calculation
The worked calculation below uses five abstract activities. Real projects have fifty or a hundred and the same arithmetic applies, just more of it. The point of a small critical path method example is to make the numbers checkable by hand, which is worth doing at least once before trusting the software output.
| Activity | Duration | Predecessor | ES | EF | LS | LF | Float |
|---|---|---|---|---|---|---|---|
| A | 4 days | — | 0 | 4 | 0 | 4 | 0 ★ |
| B | 6 days | A | 4 | 10 | 4 | 10 | 0 ★ |
| C | 3 days | A | 4 | 7 | 7 | 10 | 3 |
| D | 5 days | B, C | 10 | 15 | 10 | 15 | 0 ★ |
| E | 3 days | D | 15 | 18 | 15 | 18 | 0 ★ |
★ = critical path | Pink = critical activities | Project duration = 18 days | Critical path: A → B → D → E
Activity C has 3 days of float. It feeds into D, but D’s Early Start is driven by B (which finishes on day 10), not C (which finishes on day 7). So C can slip up to 3 days without affecting D. If C slips 4 days — starts day 8 instead of day 4, finishes day 11 — D can’t start until day 11, E can’t start until day 16, and the project ends on day 19. C goes from non-critical to critical. That’s the mechanic. It’s not unusual; it happens during execution all the time on near-critical activities, and it’s invisible unless you re-run the calculations.
Float: Total, Free, and Near-Critical Path
Total float is how much an activity can delay without pushing the project end date. Free float is how much it can delay without affecting any immediate successor’s start. The distinction matters: an activity might have 8 days of total float but zero free float if its successor is waiting on it. In that case, any slip delays the next team even though the project end date technically has room.Any critical path method example will show activities where these two numbers differ — C in the worked example above has 3 days of total float and 3 days of free float, but that’s because it has only one successor. On more complex networks the two diverge frequently.
Total float is also shared along a path. If a path has 5 days of float and one activity uses 3, the remaining activities on that path are down to 2. It doesn’t regenerate. A team that treats float as a standing buffer rather than a finite one tends to discover this the hard way, usually when the last activity on a path has zero float and the project manager is asking why something that had “plenty of time” suddenly doesn’t.
Near-critical activities — those with small positive float — deserve the same attention as the critical path in execution. On a nine-month project I’d flag anything with less than a week. A resource reassignment, a minor scope query, one bad fortnight, and an activity with four days of float can reach zero before anyone notices the float report has changed.
CPM vs PERT vs Gantt Chart
These three get conflated often enough that it’s worth being clear about what each one is. CPM is the analysis method — the forward and backward pass calculations that find the longest path and the float on each activity. The Gantt chart is a display format — bars on a timeline, optionally with dependency lines shown. You can have a Gantt chart built on CPM analysis, and you can have a Gantt chart with no CPM behind it at all. Most organisations have the second kind and call it CPM.
PERT uses three estimates per activity — optimistic, pessimistic, most likely — and calculates a weighted average duration. It’s more honest about uncertainty than CPM’s single-point estimates, but it requires more work and the probabilistic output is harder to use in a client meeting. PERT is relatively uncommon outside aerospace and defence, where it’s sometimes contractually required. For most construction and engineering projects, CPM is the default.
| CPM | PERT | Gantt | |
|---|---|---|---|
| Duration estimate | Single point | Three-point weighted | Single point |
| Identifies critical path | Yes | Yes | Only if CPM applied |
| Handles uncertainty | No | Yes | No |
| Primary use | Schedule analysis | Probabilistic planning | Visual reporting |
See the PERT method article for a more detailed comparison.
a vısual Critical Path Method Example
Below is a visual critical path method example. After the identification of activities and establishing their dependencies, a network diagram can be drawn. Below figure illustrates a simple network diagram.

By the help of the Forward Pass and Backward Pass calculations, the earliest start and finish dates, and the latest start and finish dates for each activity can be identified and the Critical Path of the network diagram can be determined.
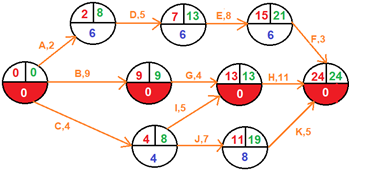
In this critical path method example, longest path is: 0 → B → G → H
CPM During Execution
Float gets consumed. Near-critical paths creep toward zero. A path that had two weeks of float at baseline might have four days left by month five. None of this is visible from a Gantt chart that hasn’t been updated. Whether you find out in month five or month nine depends on whether anyone is re-running the calculations.
I was involved in a programme review — rail civils, multiple tier-one contractors, a project that had been running about 18 months when I got involved — where the CPM analysis had been done at tender, updated for the baseline submission, and then essentially left alone. Progress got reported against the baseline. Float was never recalculated against actual remaining durations. By the time anyone ran a current CPM update, three paths that had been near-critical at baseline had consumed all their float independently of each other and converged into a new critical path that nobody had been tracking. The claim in the delay analysis was that the overrun was “unforeseeable.” I’m honestly not sure that held up — the data had been pointing this way for months, it just hadn’t been looked at.
CPM works as an execution tool when the schedule gets updated against actual progress — weekly on critical phases, monthly at minimum elsewhere — and when each update re-runs the forward and backward pass against remaining durations, not just tracks actuals against the baseline. The question isn’t “are we on programme?” It’s “has the critical path changed since last month, and if so, what changed it?”
The One Thing CPM Is Actually Good For
The most useful output of CPM is a short list of activity names — the ones you cannot let slip. Not a diagram, not a percentage. Specifically: these three activities are driving your end date right now. Any week where that question isn’t asked and answered is a week where the critical path might have changed without anyone noticing. I’ve sat in progress meetings where “we’re 78% complete” was reported with apparent satisfaction while two critical path activities were sitting behind programme with nobody mentioning it. A current CPM update would catch that. A twelve-month-old CPM baseline won’t.
Float quantification is underused. Knowing an activity has ten days of float means you can deprioritise it for a week without consequences, reassign a resource to something more critical, or absorb a minor scope addition. That information exists in most project schedules and mostly goes unused because the float report hasn’t been updated recently enough to reflect current reality.
Schedule compression — fast-tracking or crashing — requires knowing the current critical path. You cannot compress what isn’t driving the end date, so without a current CPM update, you’re guessing at which activities to target. The schedule compression article covers the cost-slope analysis that makes crashing decisions rational rather than instinctive.
The Inputs Are the Problem, Not the Method
The single-point duration estimate is the obvious limitation. An activity that might realistically take anywhere from 8 to 15 days gets assigned 11 and the calculation proceeds from there. The PERT method uses three estimates to model that uncertainty, though it adds its own complexity and assumptions.
CPM assumes unlimited resources. It schedules activities whenever the logic allows, regardless of whether the people or equipment are actually available. A programme showing no float can still have resource conflicts that introduce delays the network logic doesn’t see. Resource levelling addresses this, but adds significant complexity to the model and to the updating process.
The inputs drive everything and the inputs are guesses. Missing activities produce silent errors. Soft dependencies that should have been questioned add unnecessary duration. Padded estimates hide real float. The calculation is deterministic and precise regardless of how uncertain the inputs are — the output number looks authoritative whether the estimates are good or not. The precedence diagramming example article shows the mechanics of the calculation in detail, which helps develop a feel for where errors tend to propagate.
The critical path shifts during execution. Running CPM once at baseline and reporting against it for the next twelve months is schedule decoration, not schedule management. The actual limitation isn’t in the method — it’s that most organisations treat a living analysis tool as a static planning output.

Linda Maltz is vice president of design and consulting at Cuboca, a project management training and consulting organization specializing in construction management and BIM. She is certified Primavera P6 Trainer.


CPM is one of the most important concepts in project management, and certainly among the most enduring. The CPM is a cornerstone of project planning !!