

How to perform VLOOKUP in Power BI? VLOOKUP is an Excel function and it is known for ability to search for a value in the first column of a range and return a value in the same row from a specified column. When it comes to Power BI, a direct VLOOKUP function doesn’t exist. However, the function can replicate and even enhance Power BI’s features like DAX LOOKUPVALUE example and transformations in the Query Editor.
Table of Contents
Understanding Power BI’s VLOOKUP
Power BI is Microsoft’s interactive data visualization and analytics tool. And it has transformed the way businesses approach data analysis and reporting. While Excel users might be familiar with using VLOOKUP for merging and searching data, Power BI offers even more powerful and flexible ways like DAX LOOKUPVALUE and the RELATED function.
Power BI VLOOKUP from Another Table
In Power BI, the concept of performing a VLOOKUP from another table is about creating relationships between tables and using specific DAX functions. In Excel, VLOOKUP searches for a value in a column and return a value from a different column in the same row. But Power BI handles this through its relational data model.

Vlookup in Query Editor Power BI
The Query Editor in Power BI provides a graphic for transforming and preparing data before analysis. You can perform actions similar to VLOOKUP by using the Merge Queries feature. So, you can combine data from different sources based on a common key. It is similar to how you might use VLOOKUP to find and bring in info from another table.
Power BI RELATED Function
The RELATED function in Power BI is within the context of data models. All these models have established relationships. Hence, you can fetch a related value from another table. This will be closely mimicking the VLOOKUP functionality. But it adds a requirement for a relationship between the tables exists.
DAX LOOKUPVALUE Example
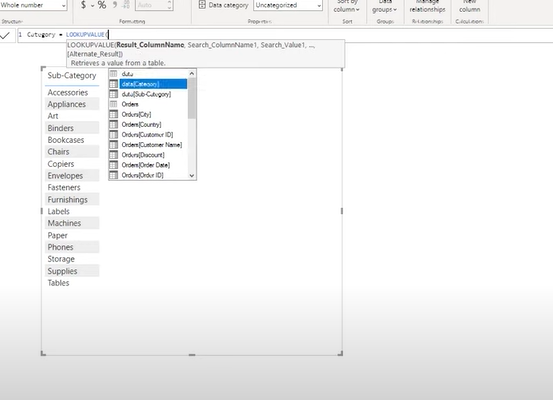
The LOOKUPVALUE function in DAX (Data Analysis Expressions) is Power BI’s closest equivalent to Excel’s VLOOKUP. Here, you can search for a value in a table. And it return a result from the same row but a different column. Here’s a simple example:
LOOKUPVALUE(ReturnColumn, SearchColumn, SearchValue)
This formula looks up SearchValue in SearchColumn and returns the corresponding value from ReturnColumn. It is particularly useful for scenarios with direct relationships between tables haven’t been established. Or when you are looking up values based on multiple criteria.
Benefits of VLOOKUP-like Features in Power BI and How to Use Them
With Power BI’s advanced data modeling and DAX functions, users can achieve and surpass the traditional capabilities of Excel’s VLOOKUP function.
Benefits of Using VLOOKUP-like Features in Power BI
- Power BI offers some great features for data modeling. Its capabilities are ideal for creating complex relationships between different data tables.
- The advanced lookup options in Power BI are pretty good. With DAX functions like LOOKUPVALUE and RELATED, you can have more flexibility than Excel’s VLOOKUP. Even you can use multiple criteria in lookups.
- Using Power BI’s relational data model improves data integrity. This means lookups are more accurate and there’s less chance of errors compared to manual VLOOKUP.
- Also, Power BI automates the process of finding and retrieving data across tables.
How to Use VLOOKUP-like Features in Power BI
Power BI VLOOKUP from Another Table
- First, you should have a relationship between the tables. This can be done in the Model view by dragging a line between the related fields in the two tables.
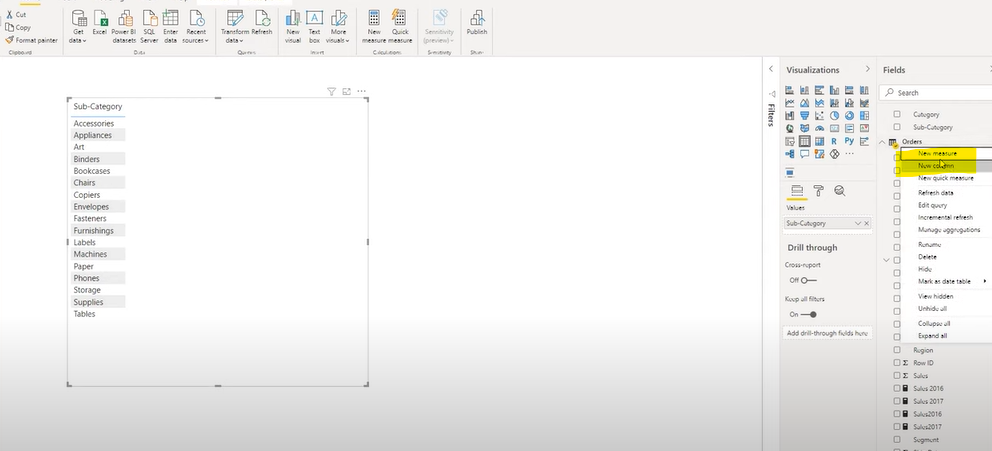
- In a new column or measure, you should use the RELATED function to pull data from a related table. If there is no direct relationship, you may also consider using LOOKUPVALUE to perform based on specific criteria.
The Ultimate Guide to a Power BI Career: How to Learn Power BI? – projectcubicle
Vlookup in Query Editor Power BI
- Merge Queries: You can access the Query Editor, select the primary table and then choose Merge Queries from the Home tab. After you should select the table you want to merge with and specify the matching columns to perform the lookup.
- Expand the Merged Column: After merging, you need to expand the merged column to include the specific columns you need from the secondary table.

Using the DAX LOOKUPVALUE Example
- Syntax: In Power Bi world, you should familiarize yourself with LOOKUPVALUE syntax:
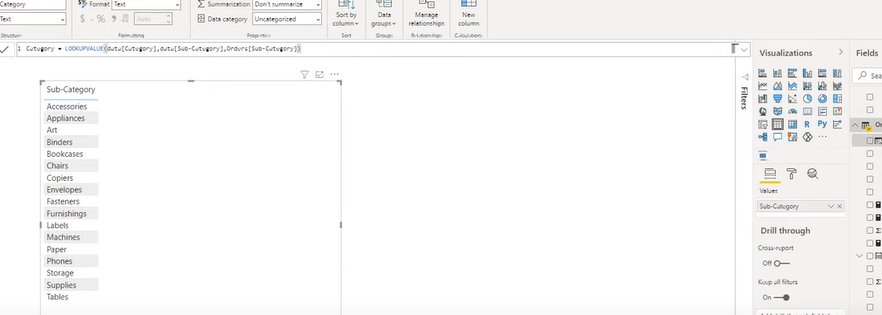
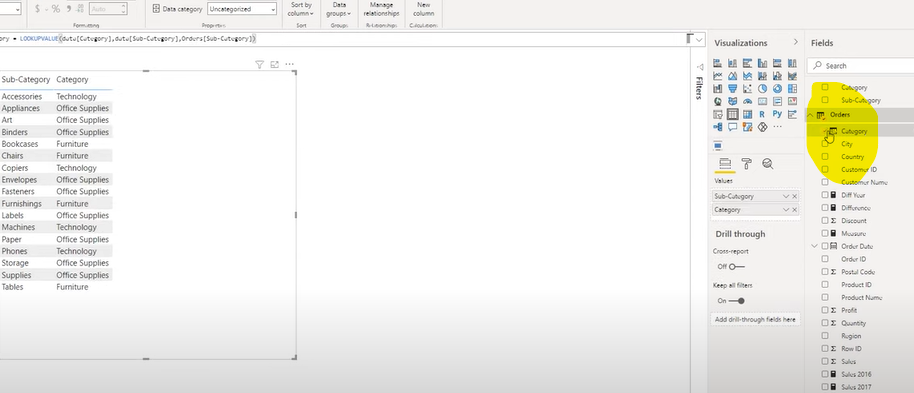
LOOKUPVALUE(result_column, search_column, search_value, [default_value]). - Now you will create a new column in your table where you want the lookup result to appear. You can use the LOOKUPVALUE function to specify which value you want to find and from which column. Because it is based on a matching value in another column.
Power BI RELATED Function
- As a first step, you should establish a direct relationship between the tables. This is a prerequisite for using the RELATED function.
- Now, you can use the RELATED function in new column within a table to pull in values from a column in a related table. This is particularly useful for fetching related information in separate tables.
Power BI uses DAX (Data Analysis Expressions) as its formula language. Below you can find fundamental DAX formulas related to data lookups, relationships and data transformation.
- LOOKUPVALUE: This function looks for a value in a column and returns a result from the same row from a different column or the same column.
LOOKUPVALUE(result_column, search_column, search_value[, search_column2, search_value2,...])
- RELATED: It can fetch a value from another table that is related to the current table. This function requires a relationship to exist between the tables.
RELATED(Table[Column])
- RELATEDTABLE: This one returns a table that contains all rows related to the current row.
RELATEDTABLE(Table)
- FILTER: While this returns a table if it represents a subset of another table’s data based on a given condition.
FILTER(Table, Expression)
- CALCULATE: As the name suggests, it changes the context in which a data expression is evaluated. It is often used with filter expressions.
CALCULATE(Expression, Filter1, Filter2,...)
- ALL: All function removes all filters from a table or column. And it can be useful in CALCULATE functions to modify filter contexts.
ALL(TableOrColumn)
- RELATEDTABLE: While this one fetches table related to another table through an existing relationship.
RELATEDTABLE(related_table)
- SUMX: It evaluates each row of a table and then sums the results.
SUMX(Table, Expression)
- AVERAGEX: While this one evaluates an expression for each row of a table and then calculates the average of the results.
AVERAGEX(Table, Expression)
- CONCATENATEX: Again this formula evaluates an expression for each row of a table and then concatenates the text results. In this way, it is separating them with a specified delimiter.
CONCATENATEX(Table, Expression, Delimiter)
Vlookup in Query Editor Power BI
The Query Editor in Power BI is a powerful tool. Although it doesn’t have a direct VLOOKUP function, it offers different features to merge tables effectively. This process is similar to performing a VLOOKUP if you are matching values from one table to another.
- Merging Queries as a VLOOKUP Alternative: In the Query Editor, you can use the Merge Queries option to combine data from two tables based on a common column. This operation is similar to VLOOKUP. But here, you specify the primary table and the table you want to look up values from. The outcome is a combined table with matched records.
- Custom Column Creation: For more complex scenarios, you might create a custom column. It will perform a lookup by using Power Query M language.
DAX LOOKUPVALUE Example
DAX (Data Analysis Expressions) is a collection of functions, operators and constants. And these can be used in a formula or expression to calculate and return one or more values. DAX LOOKUPVALUE is particularly useful for finding specific information.
- Syntax and Application: The LOOKUPVALUE function syntax is
LOOKUPVALUE(result_column, search_column, search_value[, search_column2, search_value2, …]). It searches for thesearch_valuein thesearch_columnto return the result from theresult_column.
Power BI RELATED Function: how to use lookup value in power bi
The RELATED function in Power BI is another crucial tool for data analysis. Because it can fetch a related value from another table. But here, we are assuming a relationship already exists between the tables.
- Calculated Columns: The RELATED function works for calculated columns to bring additional details from a related table into your current table’s context. This method is particularly useful for denormalizing your data model or simplifying access to info.
Conclusion: how to do a vlookup in power bi

A dedicated Career Coach, Agile Trainer and certified Senior Portfolio and Project Management Professional and writer holding a bachelor’s degree in Structural Engineering and over 20 years of professional experience in Professional Development / Career Coaching, Portfolio/Program/Project Management, Construction Management, and Business Development. She is the Content Manager of ProjectCubicle.


