

How do i make a comparison graph in excel when you need to compare two or more data sets. Because Excel comparison chart can be an incredibly useful tool. It easily visualize the differences and similarities between different data sets. In this article, we cover the basics of creating a comparison chart in Excel. This is step-by-step instructions and best practices for optimizing your chart. But how do i make a comparison graph in excel?
Table of Contents
Section 1: What is a Comparison Chart in Excel?
A comparison chart is a visual representation of two or more sets of data. So this allows you to compare and contrast their similarities and differences quickly. Excel can work for creating these charts. So that you can easily write and compare data. Also, you can customize the chart’s appearance for your needs.
Section 2: how do i make a comparison graph in excel
Step 1: Gathering Your Data
Before you can create a comparison chart in Excel, you have your data ready. This might involve inputting data directly into Excel. Or you can import it from an external source. So you can organize your data clearly and logically with each data set in its own column.
Step 2: Select it
Once you data in Excel, you can select the cells with data you want to use in your chart. You can select multiple columns or rows by clicking and dragging your mouse around.
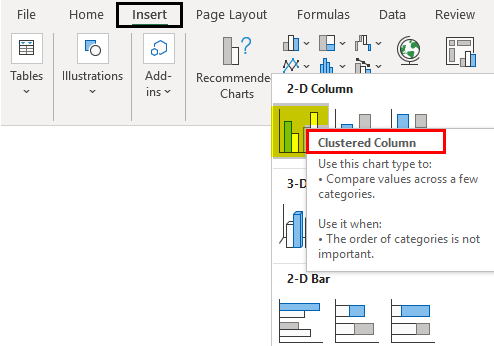
Step 3: Insert a Chart
With your data, you can click on Insert tab in the Excel ribbon. And then you will select the type of chart you want to create from the Charts section. Excel has many more chart types. These are including bar charts, line charts and scatter chart among others.
Step 4: Customize Your Chart
With your chart there, you can begin customizing it to your preference. This might involve changing the chart type, adjusting the colors and fonts. Or you can be adding titles and labels to make the chart bette looking.
Section 3: Best Practices for Creating a Comparison Chart in Excel
- A cluttered chart can be difficult to read and interpret. So you must keep your chart simple by using clear and concise labels. So you will be avoiding unnecessary elements.
- When comparing multiple data sets, it is important to use consistent scales to ensure correct comparisons.
- You can consider using color or shading to highlight the differences. So it will be clear for making analysis.
- Different chart types are better for different data types. So, you should choose the chart type that best suits your data needs.
- But do not be afraid to experiment with different chart types and designs. So, in time, you can revise your chart if you need to check effectively communicates your data.
Section 4: Conclusion to make a comparison chart in excel
A comparison chart is ideal for visualizing and analyzing data. If you are following best practices for creating these charts, you can create a clear and effective tool for comparing and contrasting different things.
Creating the Best Comparison Charts In Excel
Excel here enables you to create various comparison charts. It is basically helping you in visualizing data and making informed decisions. Here are some types of comparison charts you can use in Exce.:
How to make a monthly comparison chart in Excel
Firstly, Column Charts an excellent way to compare data across categories. They are easy to create and can display changes over time. You can also use it to compare various products or services or highlight differences between groups. Secondly, Line Charts are ideal for showing trends over time. They can track changes in sales or revenue or compare different products or services.
Best comparison chart in Excel
So, Bar Charts are similar to column charts. But they compare data within categories rather than across categories. They are frequently ideal to display data for a single point in time. Such as sales figures for a particular quarter. Fourthly, Pie Charts are good for displaying how data can show across different categories. They are useful for demonstrating market share, budget breakdowns or the distribution of different types of customers.
comparative excel sheet
Additionally, Scatter Charts can work for showing the relationship between two sets of data. They can identify correlations between different variables. Such as the relationship between advertising spend and sales. Finally, we have Radar Charts for showing multiple data sets on the same chart. They are in sports analytics to compare various players across multiple metrics.
Bonus: Year Over Year Comparison Chart In Excel: how to create a comparison graph in excel
A Year-over-Year (YoY) comparison chart on the other hand, can analyze changes in data over two or more years. Here is how to create a YoY comparison chart in Excel.
- You will gather the data for the years you want to compare.
- Then you should organize the data into columns.
- Now, you will select the data you want to include.
- Here, you will go to Insert tab and select the chart type you want to use. These can be a column chart or a line chart.
- In the Design tab, you will click on select Data / Select Data Source” window, and now
- you will click on Add.
- So in Edit Series window, you will enter a name for the series and select the data for the first year.
- Now you will click on and repeat steps 6-8 for second year.
- You can go to the Axis Titles option in Layout tab. And now, you will label the X-axis as “Year” and the Y-axis as Data.
A YoY comparison chart can help you identify trends as well as track growth or decline changing in time.

A dedicated Career Coach, Agile Trainer and certified Senior Portfolio and Project Management Professional and writer holding a bachelor’s degree in Structural Engineering and over 20 years of professional experience in Professional Development / Career Coaching, Portfolio/Program/Project Management, Construction Management, and Business Development. She is the Content Manager of ProjectCubicle.


