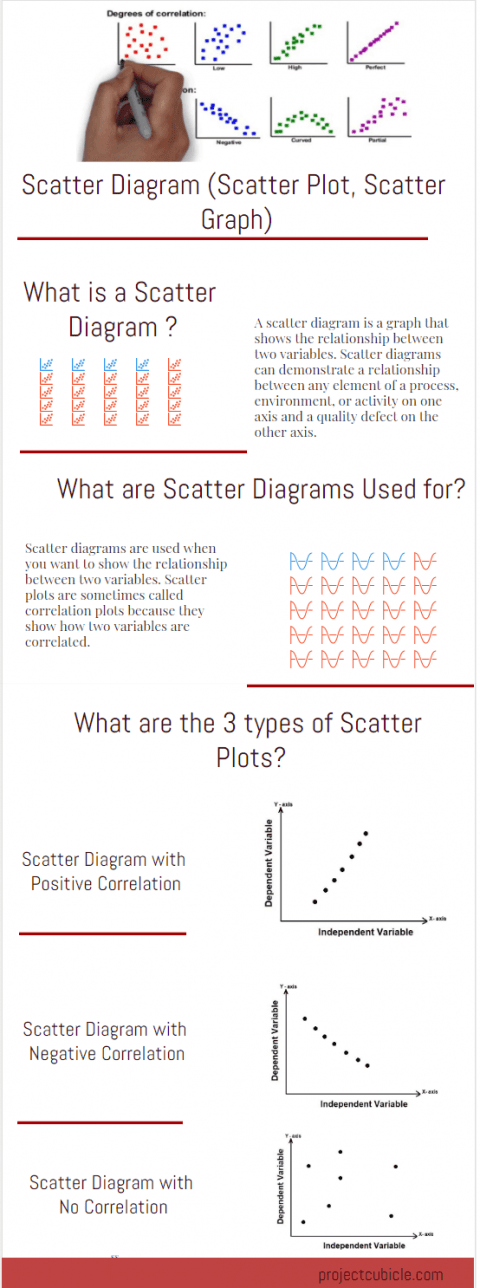
Scatter Diagram (Scatter Plot, Scatter Graph) Explained What is a Scatter Diagram? – A Scatter Diagram, which graphs pairs...
Fishbone Diagram (Cause and Effect Diagram) – projectcubicle
Julian Gerardi, , Quality Management, 2Mastering Root Cause Analysis: Unveiling the Power of the Fishbone Diagram Fishbone diagram , also known as cause and...
Latest Articles
- Why Should I Study Physics and How Do I Get Started?
- Oracle’s April 2023 Readiness for Critical Patch Update
- A Comprehensive Guide to Marketing Your New Business Successfully
- Mastering Freight Management: Tips for Getting the Best Freight Quotes
- Ensuring Compliance: Navigating the Path to FINRA-Compliant File Sharing
Templates
- Individual Development Plan Examples & Template for Managers – projectcubicle December 24, 2020
- Lessons Learned Template Example & Questions – projectcubicle October 22, 2019
- Project Risk Management Plan Template and Example – projectcubicle July 26, 2019
- A Sample Kickoff Meeting Agenda Template for Projects – projectcubicle July 25, 2019
- Statement of Work Template and Example – projectcubicle May 27, 2019


