

If you are looking ways to visualize your data and show the variability of your results, it is time to learn how to add error bars in excel. Because these Error bars can help you to show the standard deviation or standard error of your data. Also, they can tell you uncertainty in your results.
Table of Contents
What Are Error Bars in Excel? How to Add Error Bars in Excel?
Bars are graphical representations of the variability of data. They can show the standard deviation, standard error, confidence intervals or other statistical measures of uncertainty looking at your data. So, the bars are typically added to charts to show the data points’ variability.
Why Use Error Bars in Excel?
You can also compare the means or proportions of different groups or conditions.
It is possible to display the confidence intervals or margins of error belonging to such survey or polling results. And we can visualize the range of possible outcomes or predictions of a model or simulation.
- These communicate the uncertainty in your data.
- They can highlight the differences between groups or conditions.
- You can use them to show the trends or patterns in your data.
how to add error bars in excel
Adding bars to a chart in Excel is quite easy for every level of user.
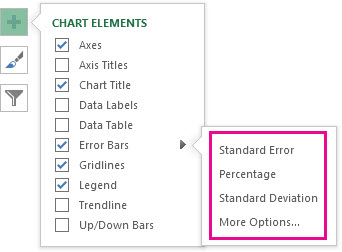
- You start with selecting the data series for adding error bars to. So, you can click on a data point or use Chart Elements button on the right of the chart.
- Then you will click on Error Bars button on Chart Elements menu.
- You choose the type of error bars that you want to add. Such as Standard Error or Percentage.
- Now, you can even customize the error bars by adjusting the values or options in Format Error Bars menu.
- Voila, you just click on Close to apply the error bars.
How to Customize Error Bars in Excel
Excel offers a range of customization options for bars and you can try them one by one.
- The type of error bars. Such as standard deviation, standard error or custom values.
- The direction and length of the error bars like as plus or minus or custom values.
- The line style, color and thickness.
- The cap style, color and width of them.
- The values or formulas to calculate the error bars.
If you wish to customize error bars in Excel, you can use Format Error Bars menu. This appears when you select an error bar on the chart.
How to Delete Error Bars in Excel
If you want to remove error bars, you can do so by selecting the data series and clicking on Error Bars button again. Then, you choose None as the error bars type. And you click Close to apply the changes. Alternatively, you can select the error bars themselves and press the delete key in the most basic way.
Error Bars in Excel: FAQs
How Do You Calculate Error Bars in Excel?
There are several ways to calculate bars in Excel. But this is depending on the type of data and the statistical measures that you want to use.
excel graph for standard deviation
- Standard deviation: You can use the STDEV function and then multiply it by a factor to determine the size of the error bars.
- Standard error: Again, you will use STDEV function to calculate the standard deviation first. Then you will divide it by the square root of the sample size.
- Confidence intervals: Here, the CONFIDENCE function can calculate the confidence interval and then you will use the upper and lower bounds as the error bars.
- Custom values: It is also possible to manually enter the values or formulas you want to use as the error bars.
What Do excel error bar Tell You? How to calculate error bars?
Bars can tell you several things about your data such as variability or spread of the data points. As well as, range of prediction interval of the data.
Bars can help you interpret the data and draw conclusions. Because these bars use results of statistical significance or practical relevance.
Types of Error Bars
You can check different error bars including the most common ones below.
- Standard deviation basically shows the variability of the data points around the mean or average.
- Yet, Standard error states a uncertainty or error in the mean or proportion of the data.
- Confidence intervals actually mean range of values that the true mean or proportion of the data is likely to fall within with a certain level of confidence.
- Percentage tells us size of the error bars as a percentage of the data points.
You can choose the type of bars most appropriate for your data and research question.
How Do You Interpret Bars?
Interpreting error bars in Excel depends on several factors such as type of error bars that you are using as well as size and direction. You can change sample size and variability and also research question along with hypothesis.
Generally, larger bars indicate greater uncertainty or variability in the data. While smaller bars indicate greater precision or certainty. If the error bars overlap between groups or conditions, it usually means no significant difference between them. But if the bars do not overlap, it suggests a significant difference.
How to Change the Color of Bars in Excel?
To change the color of the error bars, you can select the bars and use Format Error Bars menu to choose a different line color. You can also use Format Painter tool to copy the color of one error bar and simple paste.
Conclusion
Error bars work on the variability and uncertainty in your data. By adding to your charts in Excel, you can show the standard deviation, standard error or confidence intervals. Also you can even use other statistical measures and make more accurate and informative interpretations. With the simple steps we showed you, you can easily add and customize error bars in Excel now on.
So next time you analyze data in Excel, don’t forget to add bars to your charts and graphs for a deeper analysis.

A dedicated Career Coach, Agile Trainer and certified Senior Portfolio and Project Management Professional and writer holding a bachelor’s degree in Structural Engineering and over 20 years of professional experience in Professional Development / Career Coaching, Portfolio/Program/Project Management, Construction Management, and Business Development. She is the Content Manager of ProjectCubicle.


