

Dot plots can be a great solution if you wanna create a visually appealing data for your report or presentation. Here in this guide tough, we will learn about practical tips for creating dot plots in Excel.
Table of Contents
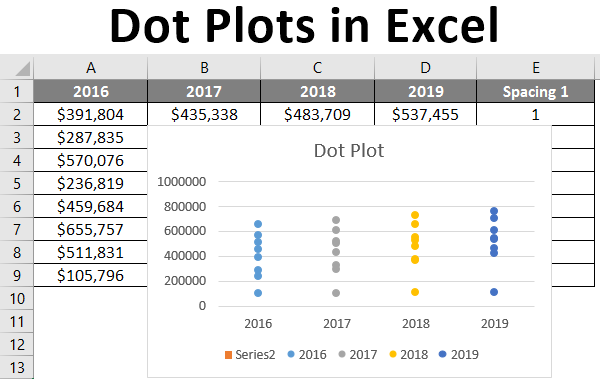
Even though dot plots aren’t directly included in Excel or its variants, you can still create them in Microsoft Excel with a few steps using standard bar charts.
What Is Dot Plots In Excel?
So, dot plots are a simple yet effective way to represent data. They can display frequency distributions, compare two or more different data. Also, they are another alternative for showing changes over time. Unlike other chart types, these are less popular than others. But they have many advantages such as being easy to read. And most importantly, their minimalist design makes them perfect for presentations or reports.
Advantages of make a dot plot and Dot Chart
- These are easy to read and interpret.
- They have a Minimalist design.
- These are Ideal for use in reports and presentations.
- You can effectively show changes over time
- They are better for comparing two or more sets of data than boring charts or tables.
Creating a Dot Plot and excel dot graph: how to make a dot plot in excel
Creating a dot plot in Excel is relatively easy and you can do it in a few steps.
- You will enter your data into an Excel worksheet
- Then, it is time to select the data range for your dot plot.
- You should click the Insert tab on the ribbon
- In Charts group, you will select Scatter and then Scatter with Straight Lines and Markers.
- Your dot plot will appear on the worksheet
Customizing Your Dot Plot and dot chart in excel
Excel can customize your dot plot to suit your specific needs. Like below.
- You can change the size and color of your markers.
- Then it is possible to change the X and Y axis labels.
- You can add a title to your chart.
- It is possible to change the background color of your chart
- And why not adding data labels?
Dot Plots vs. Other Chart Types: how to create a dot plot in excel
Dot plots are relatively unknown chart type. But they have many advantages over other chart types. Here we will compare them to other chart types.
dot plot in excel vs. Bar Charts
Dot plots can compare to bar charts because they are both used to display frequency distributions. However, dot plots have several advantages over bar charts such as below.
- Dot plots are easier to read and interpret.
- They use less ink and paper.
- And these are more visually appealing than other boring charts.
Dot Plots vs. Line Charts
Line charts can show changes in certain time period but you can use dot plots for that as well. Also, they have some advantages over line charts such as below.
- Dot plots are simpler.
- They are more aesthetic.
Frequently Asked Questions on how to construct a dot plot in excel
What is making a dot plot in excel?
A dot plot is a chart type. And it displays data as dots on a horizontal or vertical axis.
Q: What are the advantages of using a dot plot?
Because they are to read and have a minimalist design. They are way more ideal for use in reports and presentations.
Q: How to create a plot in Excel?
Creating a dot plot in Excel is relatively easy. You will enter your data, select the data range and click the Insert tab on top.
Q: Can I customize my plot in Excel?
Yes, you can customize your dot plot in Excel. You can change the size and color of your markers, the X and Y axis labels, add a title to your chart and do more things.
Q: How do dot plots compare to other chart types?
They have several advantages over other chart types. Such as bar and line charts. They are easier to read and way more good looking.
Q: Are dot plots common in Excel Users?
Actually no. Because dot plots are less used chart type in Excel. However, they can be a useful tool for representing data in better ways.
Conclusion
In conclusion, dot plots are great alternative to represent data in Excel. They can create great visuals for presentations. With the customization options available in Excel, you can easily tailor your dot plot for your case.
So, next time you should consider using a dot plot in Excel for a great report prep. With the comprehensive guide above, you can create one and impress your audience.
No version of Microsoft Excel comes with automatic Dot Plot feature tough. However, you can use a mix of a scatter chart and a basic bar chart to make this graph.
Despite having dots within, a scatter plot is not exactly a dot plot.
Final Thoughts
If you are data analyst, presenter or just someone who wants to present data, dot plots are an excellent choice. When you get the main points we told, you can easily create a dot plot in Excel. Then, you can customize it to suit your specific needs.
But here what matters is keeping in mind the principles of good data visualization. Such as simplicity, clarity, and accuracy. Because when do you do that, you can ensure that your dot plot communicates your data to your audience.

A dedicated Career Coach, Agile Trainer and certified Senior Portfolio and Project Management Professional and writer holding a bachelor’s degree in Structural Engineering and over 20 years of professional experience in Professional Development / Career Coaching, Portfolio/Program/Project Management, Construction Management, and Business Development. She is the Content Manager of ProjectCubicle.


