

The PERT Method – Program Evaluation and Review Technique Example & Definition
Project managers often use graphical representation tools to understand their projects’ performance. CPM, Gantt, and PERT Charts are used to demonstrate workflow and sequence of activities. Although both scheduling tools serve the same purpose, they are different from each other. In this article, we will discuss the PERT definition and demonstrate how to use PERT Method with the help of an example. The PERT Method (or Program Evaluation and Review Technique) is one of the most common scheduling techniques for network analysis which is used to track and coordinate complex tasks. PERT Method helps to analyze the project work schedule by focusing on each task and calculate the minimum time required to complete the project. In this respect, it is similar to the Critical Path Method (CPM). Both of them uses a common approach for preparing the network and determining its critical path. But there are some key differences between PERT Method and CPM.
Table of Contents
What is the Definition of PERT? (Program Evaluation and Review Technique)
PERT Method (Program Evaluation and Review Technique) was first developed by the US Navy SPO (Special Projects Office) in 1967 during the Polaris missile development program then it was applied to the other industries. Both CPM and PERT are complementary tools and they are developed at roughly the same time. Unlike other methods, PERT is an event-oriented technique that uses three-time estimates (optimistic, expected, and pessimistic) for each task. With this aspect, it employs uncertainty while calculating the task durations. These characteristics make the PERT Method (Program Evaluation and Review Technique) useful for large-scale, complex, and non-routine projects.
The WBS (Work Breakdown Structure) concept which divides the scope into manageable sections was developed in conjunction with the PERT Method.
Why Would You Use a PERT Chart?
One of the most important responsibilities of a project manager is making correct estimations. Since projects are full of uncertainties, it is often difficult for a project manager to foresee what will happen tomorrow. Besides, project sponsors and key project stakeholders never like uncertainty regarding project costs and milestone dates.
The project manager’s role and responsibilities include reducing and mitigating negative project risks as well as increasing the possibility of opportunities.
Project managers should use PERT charts in conjunction with other tools and techniques if they need more accurate and forecasts. Because PERT Chart employs three time estimations to provide you an average result.

Key Differences Between the PERT Method and CPM
Below are some key differences between the PERT Method and the CPM (Critical Path Method)
– In the Critical Path Method activity durations are well defined but in PERT Method, time estimations are uncertain.
– The Critical Path Method is a method of control of time and costs, however, PERT is a technique of planning and control of time.
– There are three estimates in PERT such as optimistic, pessimistic, and most likely. In the Critical Path Method, there is only one estimate.
– In PERT Chart, only FS relationship type is applicable. In CPM Chart 4 relationship types (FS,SS,SF,FF) can be applicable.
– PERT Chart is event-oriented however, CPM Chart is start and completion oriented.
– PERT is more applicable to research and development projects rather than CPM.
PERT Analysis Formula
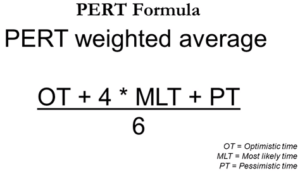
The PERT method employs simple statistic calculations. It uses three-time estimations.
- Optimistic Estimate: The shortest time required to complete the task.
- Pessimistic Estimate: The longest time required to complete the task.
- Most Likely Estimate: The most possible time (probable duration) required to complete the task.
Expected time is calculated with the help of the PERT Analysis formula below
Expected time = ( Optimistic + 4 x Most likely + Pessimistic) / 6
The PERT Method Implementation Steps
Track the following steps while creating a PERT Chart;
1. List the activities and milestones
The first step is to determine the tasks required to complete the project.
2. Determine the sequence of activities
The second step is to determine the order of the activities. Which activity is the predecessor which one is the successor? It is easy to determine the sequence of some activities however the sequence of some tasks may require deep analysis.
3. Build a network diagram
The third step is to create the network diagram with the help of software or by hand and place the activities on the diagram.
4. Estimate the activity durations
The PERT Method uses three duration estimates for activities which are;
- Optimistic Estimate
- Pessimistic Estimate
- Most Likely Estimate
With the help of three estimates, expected duration is calculated.
5. Determine the critical path
The critical path is the longest path of the network diagram. Forward and backward pass calculations is used to determine the critical path.
The PERT Method Example
We discussed the PERT Definition and analyze the formula above. Now we will provide a simple PERT Method example with the solution.
In the following PERT Method Example, you are a project manager of a power plant project. You tracked the steps mentioned above and listed the following inputs;
- All the Activities
- Predecessors
- Optimistic, Pessimistic, and Most Likely Activity Durations
By using “The Pert Formula = (To + 4Tm + Tp)/6”, you calculated the expected duration for each activity.
All the inputs are listed in the table below.
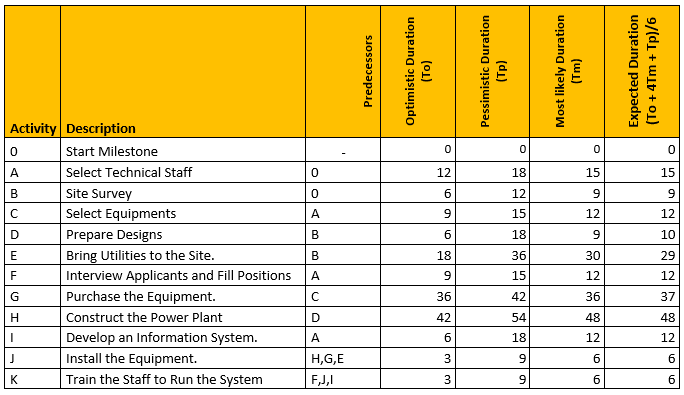
PERT – Program Evaluation and Review Technique Example
After building a network diagram and estimating the activity durations, you will determine the critical path by making forward and backward pass calculations.
Forward Pass Calculations specify the minimum dates at which each activity can be performed and, ultimately, the minimum duration of a project.

PERT -Forward Pass Calculation
Backward Pass Calculations of Program Evaluation and Review Technique determine the latest dates by which each activity can be performed without increasing the project’s minimum duration.
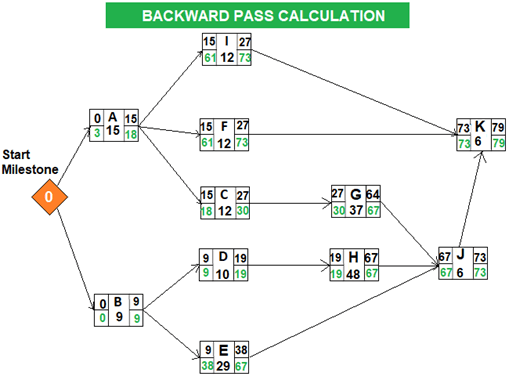
PERT -Backward Pass Calculation
After completing the backward pass calculation, you can easily determine the critical path. In project management, “float” or “slack” is the amount of time that a task can be delayed without affecting the deadlines of other subsequent tasks, or the project’s final delivery date. Total float/slack is 0 on the critical path.
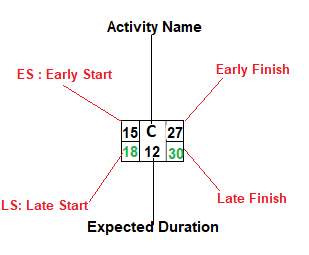
PERT Method -Activity
Total Float: LS – ES = 18-15 = 3
Total Float: LF – EF = 30-27 = 3
The total float can be calculated by subtracting the Early Start date of an activity from its Late Start date or Early Finish date from its Late Finish date.
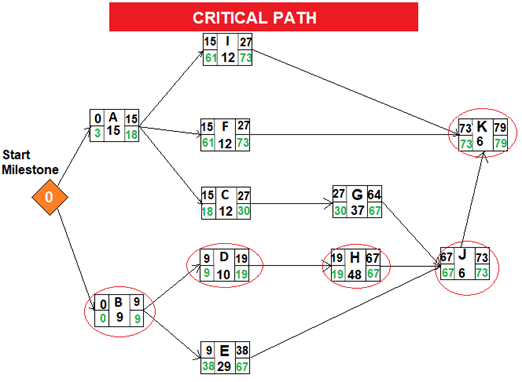
Critical Path
When we analyze the network diagram we will see that there are some paths and every path have duration.
The critical path is the longest path in the network diagram and the total float of the critical path is zero.
Summary
In real life, projects are not executed as it was planned all the time. Risks, unexpected events, uncertainty, and subjective estimates are significant reasons for deviations. PERT Chart is helpful for estimating the project completion time in case of uncertainty. However, it may be difficult to use without software.
In this example, we talked about the PERT definition and calculated the expected duration for each activity and anayzed the difference between PERT Method and CPM. By making forward, backward calculations, we determined the critical path. Accuracy of expected durations that affect the critical path depends on the optimistic, pessimistic, and most likely duration estimates. With the help of PERT Chart software, it is easy to make these calculations efficiently for many combinations.

Irma Gilda is chief executive of Sonic Training and Consultancy Co., the training platform offers project planning and scheduling More than 60 k learners have used the platform to attain professional success. Irma is a professional Primavera P6 Trainer.


Comment:is that expected project length and expected time are meant to be same?
Yes they are
Nice
Excellent description.
I have a problem in that suppose, we have only the optimistic and the pessimistic times. The most likely times are not given. In such case can I take the average of the two as the expected time.
2ndly suppose it is given that the time of an activity follows a normal distribution with a mean m and sigma of s; how do we proceed.
Thanks and regards
virendra
This was really helpful
Can you show us also provide gantt diagram in the solution