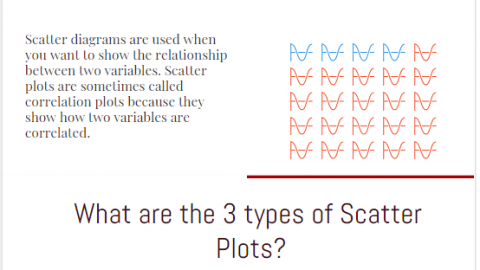
Scatter Diagram (Scatter Plot, Scatter Graph) Explained What is a Scatter Diagram? – A Scatter Diagram, which graphs pairs...
Quality Management
Discover Project Cubicle’s Quality Management section for essential insights on maintaining top-notch standards in every endeavor. 🌐🚀 #QualityManagement #ProjectCubicle
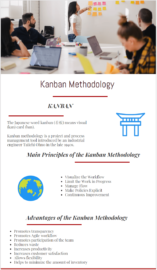
Kanban Methodology for Project Management Kanban methodology is a project and process management tool developed by an industrial engineer...
Accuracy vs Precision in Quality Management – projectcubicle
Julian Gerardi, , Quality Management, 0
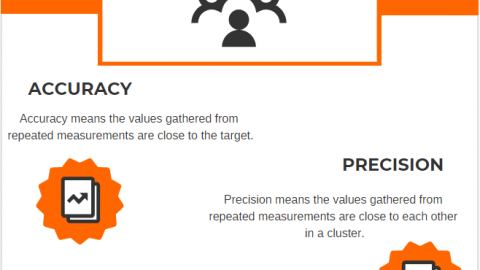
Accuracy vs Precision: Unveiling the Key Distinctions in Quality Management While evaluating the results after taking data measurements, you...
Corrective Action vs Preventive Action vs Defect Repair – projectcubicle
Julian Gerardi, , Quality Management, 0
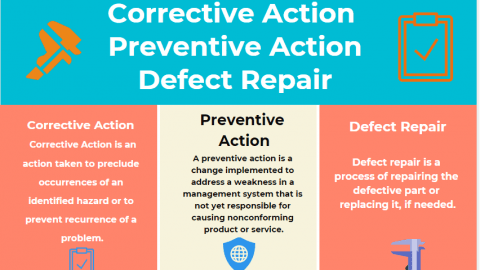
Corrective Action vs Preventive Action vs Defect Repair In the Quality Management System, corrective action eliminates the cause of...
Grade and Quality Terms in Project Management – projectcubicle
Julian Gerardi, , Quality Management, 0
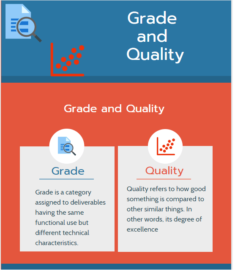
Grade vs Quality Explained with Examples Grade vs Quality is one of the most popular articles in our blog....
Pareto Chart (Pareto Analysis) in Quality Management – projectcubicle
Julian Gerardi, , Quality Management, 2
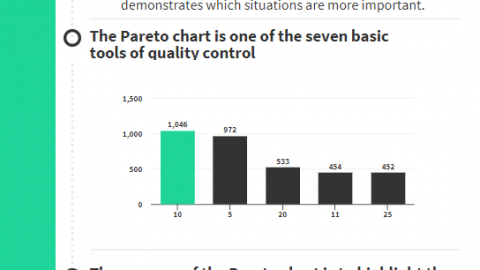
What is Pareto Chart (Pareto Analysis) in Quality Management? There are many tools, techniques, diagrams, and charts are used...
5s Methodology & Principles in Project Management – projectcubicle
Julian Gerardi, , Project Management, Quality Management, 1
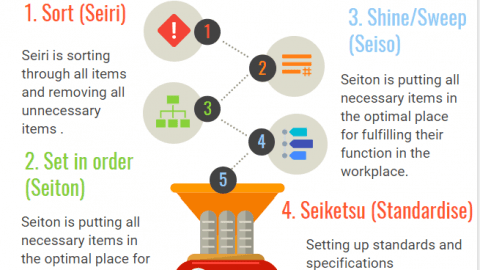
5s Methodology & Principles in Project Management Organizations often try to change their production system to achieve more work...
Common Cause Variation vs Special Cause Variation – projectcubicle
Julian Gerardi, , Quality Management, 1
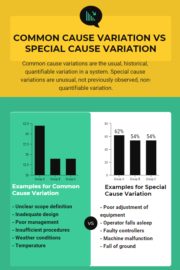
Common Cause Variation vs Special Cause Variation What are the causes of variation in quality control or what are...
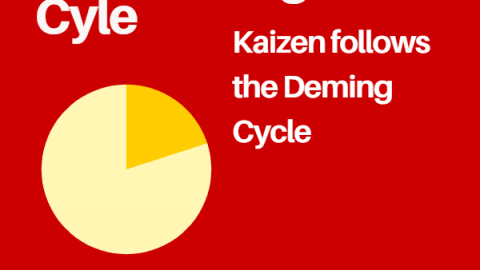
Kaizen Methodology for Process Improvement Productivity is very important in today’s competitive business environment. Organizations seek ways of improving...
Fishbone Diagram (Cause and Effect Diagram) – projectcubicle
Julian Gerardi, , Quality Management, 2
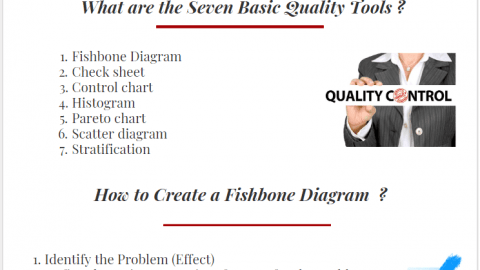
Mastering Root Cause Analysis: Unveiling the Power of the Fishbone Diagram Fishbone diagram , also known as cause and...
Latest Articles
- Mastering the Art of Content Creation: A Blueprint for Business Success
- Harnessing the Power of Predictive Analytics and Machine Learning in Software Solutions
- Building an Ethical Culture: Implementing Effective Codes of Conduct in Projects
- How to Incorporate Virtual Spaces into Your Startup’s Everyday Operations
- Website Performance and Its Impact on Your Digital Marketing and Overall Business
Templates
- Individual Development Plan Examples & Template for Managers – projectcubicle December 24, 2020
- Lessons Learned Template Example & Questions – projectcubicle October 22, 2019
- Project Risk Management Plan Template and Example – projectcubicle July 26, 2019
- A Sample Kickoff Meeting Agenda Template for Projects – projectcubicle July 25, 2019
- Statement of Work Template and Example – projectcubicle May 27, 2019